《Programming Collective Intelligence》读书笔记 (3)-- 聚类
《Programming Collective Intelligence》(中文名为《集体智慧编程》),是一本关于数据挖掘的书籍,每一章都会通过一个实际的例子来讲述某个机器学习算法,同时会涉及到数据的采集和处理等,是一本实践性很强的书籍。
本文是本书的第三章 Discovering Groups 的读书笔记 , 主要介绍了对文本进行聚类以及对聚类后的结果进行可视化。
聚类就是将相似的数据聚合在一起,形成一类,与分类比较相似,但是又有不同。一般来说聚类没有明确的类别数目,而分类根据具体的问题在一开始就确定了所有分类的可能,而且一般用于聚类的数据不需要标签, 属于无监督算法,而用于分类的数据则需要,属于有监督的算法。常见的聚类算法有 KMeans,SOM(Self-Organized Feature Map)等,常见的分类算法则更多,如逻辑回归,朴素贝叶斯,SVM 等。
本文主要讲逐层聚类 (Hierarchical Clustering) 和 KMeans 聚类这两个聚类算法,依然会通过一个例子来阐述算法的具体实现。文中所有的数据和代码可从这里获取。
获取数据
本文使用的数据为博客文本数据,通过分析博客文本之间的相似性,从而将相似的博客聚类在一起。
通过博客的 RSS 源可以获取博客所有的文本数据,python 中提供了 feedparser 这个第三方 package 来实现这个功能,如下代码实现的功能就是获取一个博客的 RSS 中的所有文章的 summary 并进行分词统计,注意本文使用的均是英文文本。1
2
3
4
5
6
7
8
9
10
11
12
13
14
15
16
17
18
19
20
21
22
23
24
25import re
import feedparser
from collections import defaultdict
def parse_rss(target_url):
rss = feedparser.parse(target_url)
word_count = defaultdict(int)
# traverse all passages of the blog
for entry in rss.entries:
if 'summary' in entry:
summary = entry.summary # su
else:
summary = entry.description
words = extract_words(entry.title+' '+summary)
for word in words:
word_count[word] += 1
return rss.feed.get('title', 'empty title'), word_count # title can be empty sometimes
def extract_words(content):
# remove tag in the form of <XXXX>
txt = re.compile(r'<[^>]+>').sub('',content)
# split words by all non-alpha characters
words = re.compile(r'[^A-Z^a-z]+').split(content)
# turn all words into lowercase
return [word.lower() for word in words if word != '']
上面的 parse_rss 函数实现的功能就是从 RSS 的 url 中提取出所有文本的 summary(或 description),然后通过 extract_words 函数剔除 html 标签并分词,进而统计出该 RSS 源中各个词语所出现的次数。
由于聚类需要多个博客的数据,本文使用了原书提供的 100 个博客的 RSS 作为原始数据,并通过原始数据构造一个 blog-word 矩阵,行表示博客,列表示各个具体的词语,矩阵中的值表示某个词语在某个博客中出现的总次数。由于词语数目过多,因此这里会限制出现在矩阵的列的词语必须要在原始数据中出现的频率在一定的百分比。得到 blog-word 矩阵需要一定的运算量,因此将其写入到文件中进行持久化,方便下次的读取。下面就是实现上面功能的代码。1
2
3
4
5
6
7
8
9
10
11
12
13
14
15
16
17
18
19
20
21
22
23
24
25
26
27
28
29
30
31
32
33
34
35
36
37def get_content_from_feedlist(feed_list, data_file):
word_appear_count = defaultdict(int) # count thow many blogs does a word appear in
blog_word_count = {} # words of each blog
empty_title_count = 0
for rss_url in file(feed_list):
title, wc = parse_rss(rss_url.strip())
if title == 'empty title': # cannot get title of some rss
empty_title_count += 1
title = title+' %s'%empty_title_count
blog_word_count[title] = wc
for word, count in wc.items():
word_appear_count[word] += 1
# caculate the appearing percentage of each word
# record those words that appear within maximum and minimum percentage
minimum, maximum = 0.1, 0.5
word_list = []
total_blog = len(blog_word_count)
for word, count in word_appear_count.items():
if minimum <= count*1.0/total_blog <= maximum:
word_list.append(word)
# write data into data_file
with io.open(data_file, mode = 'w', encoding = 'utf8') as wf:
wf.write('Blog'.decode('utf8'))
for word in word_list:
wf.write(('\t%s'%word).decode('utf8'))
wf.write('\n'.decode('utf8'))
# words of each blog
for blog_title, blog_words in blog_word_count.items():
wf.write(blog_title.decode('utf8'))
for word in word_list:
if word in blog_words:
wf.write(('\t%s'%blog_words[word]).decode('utf8'))
else:
wf.write(('\t'+'0').decode('utf8'))
wf.write('\n'.decode('utf8'))
上面的 get_content_from_feedlist 中通过获取了 feed_list(每行一个 rss 源的 url) 中所有博客的文本,并将那些出现频率在 0.1 到 0.5 间的词语作为 blog-word 矩阵的列,出现频率的计算方法为 词语出现的博客数/总的博客数。然后将 blog-word 矩阵写入到 data_file 文件中。至此完成了获取数据的步骤。
聚类
下面将讲述两种方法对上面获取的博客数据进行聚类:逐层聚类(Hierarchical Clustering) 和 KMeans 聚类(KMeans Clustering)。
逐层聚类(Hierarchical Clustering)
逐层聚类的思想很简单,每次将距离最近的两个 cluster 进行聚类,组成一个新的类,然后重复此过程直到只剩下一个最大的 cluster。整个过程如下图所示: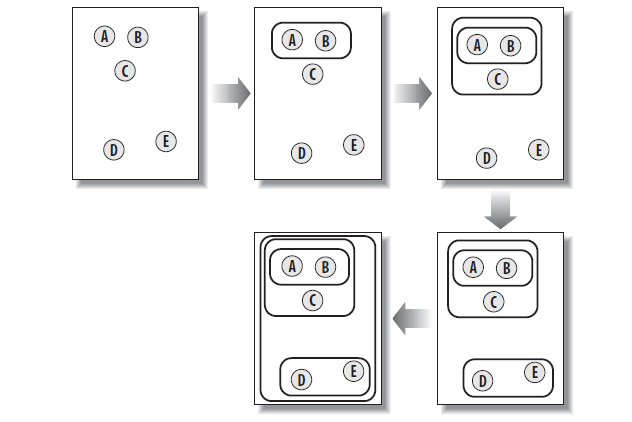
这种聚类方法的具体过程如同构造一棵树,其中每个叶子节点表示一个单一的实例,而其他节点表示由多个实例聚成的 cluster。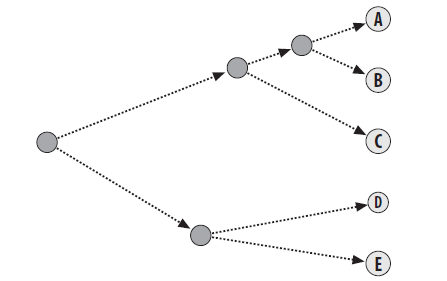
算法的思路比较简单,但是有个关键问题就是如何判断 cluster 与 cluster 之间的距离。这里采用皮尔逊系数,皮尔逊系数在这篇文章中有比较详细的描述,这里就不详细展开了,实际上皮尔逊系数就是概率论中常用的相关系数,用于表示两者的相关性,范围在 [-1, 1] 之间,其中正值表示正相关,负值表示负相关,且绝对值越大,相关性越强,这里的距离越短,表示两个的正相关性越强,因此采用 1-皮尔逊系数 作为距离的值。实现的代码如下所示:1
2
3
4
5
6
7
8
9
10
11
12
13
14def pearson(v1,v2):
# Simple sums
sum1=sum(v1)
sum2=sum(v2)
# Sums of the squares
sum1Sq=sum([pow(v,2) for v in v1])
sum2Sq=sum([pow(v,2) for v in v2])
# Sum of the products
pSum=sum([v1[i]*v2[i] for i in xrange(len(v1))])
# Calculate r (Pearson score)
num=pSum-(sum1*sum2/len(v1))
den=sqrt((sum1Sq-pow(sum1,2)/len(v1))*(sum2Sq-pow(sum2,2)/len(v1)))
if den==0: return 0
return 1.0-num/den
另外一个问题就是如何在 python 中表示一个 cluster,从上面的算法过程可知,一个 cluster 包括了它的两个子 cluster(最开始的单实例没有),cluster 的中心值等,在 python 并没有符合这种要求的数据结构,因此可以创建一个 python 类这个 cluster。
创建的 cluster 类如下所示:1
2
3
4
5
6
7
8
9class hcluster:
"""describe a cluster as a node in a tree"""
def __init__(self, id, vector, distance=0, left = None, right = None):
self.id = id
self.vector = vector
self.distance = distance
self.left = left
self.right = right
各个变量及其含义如下所示
| 变量 | 含义 |
|---|---|
| id | cluster 的唯一标示号 |
| vector | cluster 的值,即 cluster 的中心点 |
| distance | 组成 cluster 的两个子 clusters 的距离,叶子节点为 0 |
| left,right | 组成 cluster 的两个子 clusters,叶子节点为 None |
通过各个 cluster 的唯一标示号 id 可以方便进行 cluster 的合并和删除,而存储 distance 以及子 clusters 的便于后面对聚类结果的可视化。下面是逐层聚类的过程的代码1
2
3
4
5
6
7
8
9
10
11
12
13
14
15
16
17
18
19
20
21
22
23
24
25
26
27
28
29
30
31
32
33
34def hierarchicalClustering(blog_data, distance = pearson):
# initi clusters, each node is a cluster
clusters = [hcluster(id = i, vector = blog_data[i]) for i in xrange(len(blog_data))]
# use negativ number to represent cluster with more than one node
clust_id = -1
# use distance to store caculated results
distances = {}
while len(clusters) > 1:
similar_pairs = (0,1)
closest_distance = distance(clusters[0].vector, clusters[1].vector)
for i in xrange(len(clusters)):
for j in xrange(i+1, len(clusters)):
if (clusters[i].id, clusters[j].id) not in distances:
distances[(clusters[i].id, clusters[j].id)] = distance(clusters[i].vector, clusters[j].vector)
d = distances[(clusters[i].id, clusters[j].id)]
if closest_distance > d:
closest_distance = d
similar_pairs = (i, j)
merged_vector = [(clusters[similar_pairs[0]].vector[i] + clusters[similar_pairs[1]].vector[i])/2.0
for i in xrange(len(clusters[similar_pairs[0]].vector))]
new_cluster = hcluster(id = clust_id, vector = merged_vector, distance = closest_distance,
left = clusters[similar_pairs[0]], right = clusters[similar_pairs[1]])
# must delete elements from higher index to lower index
del clusters[similar_pairs[1]]
del clusters[similar_pairs[0]]
clusters.append(new_cluster)
clust_id -= 1
return clusters[0]
上面的代码重复 合并两个最邻近cluster为新cluster->调整新cluster的位置的操作,直到只剩下一个 cluster 并将该 cluster 返回。
KMeans 聚类
KMeans 聚类的思想是一开始就确认了最终需要聚类成 k 个 clusters,然后在训练数据的范围内随机选择 k 个初始点作为初始 k 个 cluster 的中心,并将每个实例聚类到离其最近的一个 cluster,所有的点都分到离其最近的 cluster 后,根据各个 cluster 中的点重新调整这个 cluster 的中心。重复这个过程直到每个 cluster 中的点不变为止。如下图为 KMeans 的过程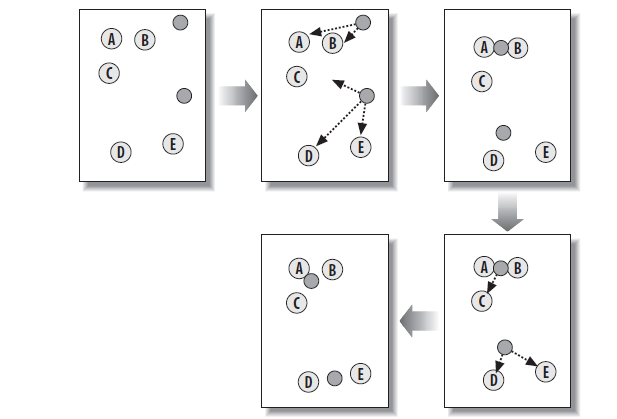
这里度量距离的方式仍采用皮尔逊系数,下面是实现以上功能的代码:1
2
3
4
5
6
7
8
9
10
11
12
13
14
15
16
17
18
19
20
21
22
23
24
25
26
27
28
29
30
31
32
33
34
35
36
37
38
39
40
41
42def kMeans(blog_data, distance = pearson, k = 5):
m, n = len(blog_data), len(blog_data[0])
max_value = [0 for i in xrange(n)]
min_value = [0 for i in xrange(n)]
for i in xrange(m):
for j in xrange(n):
max_value[j] = max(max_value[j], blog_data[i][j])
min_value[j] = min(min_value[j], blog_data[i][j])
# initial random clusters
clusters = []
for i in xrange(k):
clusters.append([min_value[j] + random.random()*(max_value[j] - min_value[j]) for j in xrange(n)])
count = 0
previous_cluster_nodes = None
while True:
count += 1
print 'iteration count %s'%count
curr_cluster_nodes = [[] for i in xrange(k)]
for i in xrange(m):
closest_distance = distance(blog_data[i], clusters[0])
cluster = 0
for j in xrange(1, k):
d = distance(blog_data[i], clusters[j])
if closest_distance > d:
closest_distance = d
cluster = j
curr_cluster_nodes[cluster].append(i)
if curr_cluster_nodes == previous_cluster_nodes:
break
previous_cluster_nodes = curr_cluster_nodes
# modify the core of each cluster
for i in xrange(k):
tmp = [0 for _ in xrange(n)]
for node in curr_cluster_nodes[i]:
for j in xrange(n):
tmp[j] += blog_data[node][j]
clusters[i] = [float(tmp[j])/len(curr_cluster_nodes) for j in xrange(n)]
return clusters, curr_cluster_nodes
上面的代码最终返回 k 个 cluster 的中心点的值,以及各个 cluster 中所包含的点(实例)。需要注意的是由于每次选择的初始点是随机的,因此每次运行所获得的结果不一定相同。
可视化
下面介绍如何将上面两种聚类算法得到的结果进行可视化,可视化通过 python 中的 python image library (PIL) 实现。
逐层聚类结果可视化
从上面的算法描述可知,逐层距离每次将两个 cluster 聚合在一起,从构造过程来看,实际上最终是构造了一颗二叉树,因此这里会以二叉树的形式将聚类的结果可视化。由于二叉树叶子节点过多,为了便于展示,将二叉树横着放,如下图就是二叉树的放置方式
要将这课二叉树可视化,首先需要知道这这棵树以上图放置时的高度和宽度 (深度),然后根据图片的大小进行相应的缩放。
回想上面在逐层聚类中定义的下面的类表示一个 cluster1
2
3
4
5
6
7
8class hcluster:
"""describe a cluster as a node in a tree"""
def __init__(self, id, vector, distance=0, left = None, right = None):
self.id = id
self.vector = vector
self.distance = distance
self.left = left
self.right = right
通过 self.left 和 self.right 属性可以访问当前 cluster 的两个子 cluster,而 self.distance 则表示两个子 cluster 的距离的大小,该属性在图中表现为当前 cluster 到两个子 cluster 的线段的长短,假如 self.distance 的值越大,那么这个 cluster 到两个子 cluster 的线段也越长。因此可以通过 distance 的值来获取二叉树的最长深度来作为图片的宽度。获取二叉树深度代码如下所示1
2
3
4def get_depth(cluster):
# The distance of an endpoint is 0.0
if cluster.left==None and cluster.right==None: return 0
return max(get_depth(cluster.left),get_depth(cluster.right))+cluster.distance
通过递归的方式将两棵字数中最长的深度加上当前节点到两棵子树的长度,便是以当前节点为根节点的树的深度。
同样地,树的高度也可以通过递归方式获取,由上面的二叉树的放置方法可知,整棵树的高度就是其两棵子树的高度之和。下面便是获取高度的代码1
2
3def get_height(cluster):
if cluster.left==None and cluster.right==None: return 1
return get_height(cluster.left)+get_height(cluster.right)
整个二叉树中有两种节点:一种是叶子节点,表示一个单一实例,另外的非叶子结点的表示有多个叶子节点组成的 cluster。对于叶子节点,只需要在图片上显示其内容即可,而对于非叶子节点则需要画出其两棵子树的分支,通过 self.id 属性可以区分节点是否为叶子节点。下面便是具体的实现代码,(注意这里需要用到 PIL 了,关于 PIL 的具体用法可参考这里)1
2
3
4
5
6
7
8
9
10
11
12
13
14
15
16
17
18
19
20
21
22
23
24from PIL import Image,ImageDraw
def draw_node(draw,cluster,x,y,scaling,blog_names):
if cluster.id < 0:
h1=get_height(cluster.left)*20
h2=get_height(cluster.right)*20
top=y-(h1+h2)/2
bottom=y+(h1+h2)/2
# Line length
ll=cluster.distance*scaling
# Vertical line from this cluster to children
draw.line((x,top+h1/2,x,bottom-h2/2),fill=(255,0,0))
# Horizontal line to left item
draw.line((x,top+h1/2,x+ll,top+h1/2),fill=(255,0,0))
# Horizontal line to right item
draw.line((x,bottom-h2/2,x+ll,bottom-h2/2),fill=(255,0,0))
# Call the function to draw the left and right nodes
draw_node(draw,cluster.left,x+ll,top+h1/2,scaling,blog_names)
draw_node(draw,cluster.right,x+ll,bottom-h2/2,scaling,blog_names)
else:
# If this is an endpoint, draw the item label
draw.text((x+5,y-7),blog_names[cluster.id],(0,0,0))
上面的 scaling 参数是根据树的深度和图片的宽度的比例得到的缩放因子,在开始画图前需要通过树的深度和图片预定义的宽度获取。下面的代码便是在作图前的需要准备的参数以及调用上面定义好的函数进行作图的过程。1
2
3
4
5
6
7
8
9
10
11
12
13
14
15
16
17
18def draw_cluster(cluster, blog_names, jpeg_path):
# height and width
h=get_height(cluster)*20
w=1200
depth=get_depth(cluster)
# width is fixed, so scale distances accordingly
scaling=float(w-150)/depth
# Create a new image with a white background
img=Image.new('RGB',(w,h),(255,255,255))
draw=ImageDraw.Draw(img)
draw.line((0,h/2,10,h/2),fill=(255,0,0))
# Draw the first node
draw_node(draw,cluster,10,h/2,scaling,blog_names)
img.save(jpeg_path,'JPEG')
作图的结果如下所示: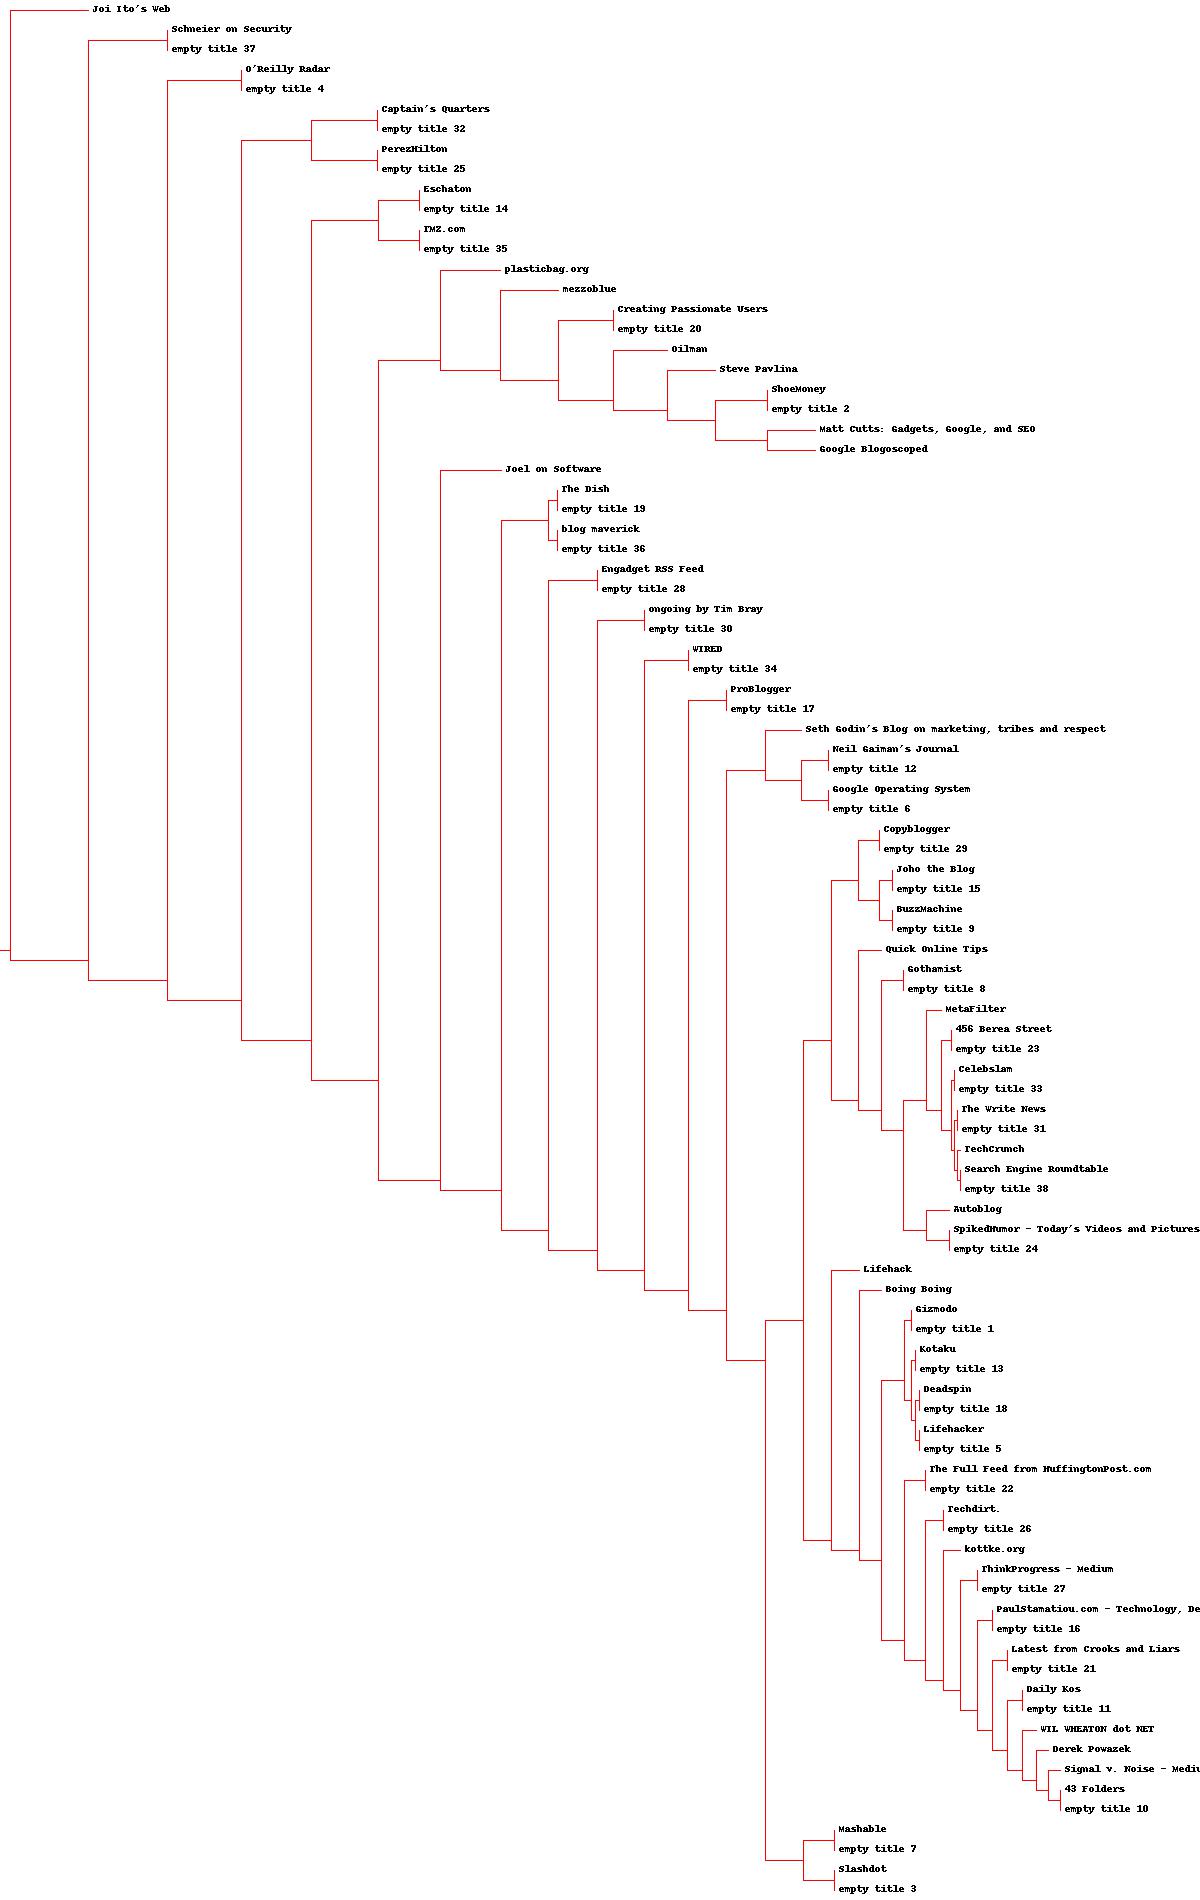
KMeans 聚类结果可视化
原书并没有给出 KMeans 聚类结果的可视化操作,只是提供了一种多维缩放 (Multidimensional scaling, MDS)的技术, 用于将高维的数据转换为二维,同时保留数据间的距离关系,这样便可通过图片对其进行可视化。实际上, MDS 与 PCA 都是一种基于线性变换而进行降维的方法。
MDS 的思想是通过点的原始距离矩阵 \(D\), 计算出变换到新的维度空间中的点的距离矩阵 \(B\), 然后对 \(B\) 做特征值分解,选取前 \(n\) 个特征值 (\(n\) 为所变换到的维度空间的维度值) 及其对应的特征向量矩阵,便可得到新的维度空间中各点的坐标。具体的推导过程可以参考周志华的机器学习中第十章的内容或这篇博客,这里不详细展开论述了。
但是该书给出的方案并不是上面讲述的方法,而是先在二维空间中随机初始化 \(m\) 个点作为 m 个实例的初始点,然后根据其在二维空间的距离与高维空间中实际的距离的误差来调整点的位置,是一种迭代的方法。其具体实现如下所示:1
2
3
4
5
6
7
8
9
10
11
12
13
14
15
16
17
18
19
20
21
22
23
24
25
26
27
28
29
30
31
32
33
34
35
36
37
38
39
40
41
42
43
44
45
46
47def scale_dowm(blog_data,distance=pearson,rate=0.01):
n=len(blog_data)
# The real distances between every pair of items
real_list=[[distance(blog_data[i],blog_data[j]) for j in xrange(n)]
for i in xrange(n)]
# Randomly initialize the starting points of the locations in 2D
loc=[[random.random(), random.random()] for i in xrange(n)]
fake_list=[[0.0 for j in xrange(n)] for i in xrange(n)]
lasterror=None
for m in range(0,1000):
# Find projected distances
for i in range(n):
for j in range(n):
fake_list[i][j]=sqrt(sum([pow(loc[i][x]-loc[j][x],2)
for x in xrange(len(loc[i]))]))
# Move points
grad=[[0.0,0.0] for i in range(n)]
totalerror=0
for k in range(n):
for j in range(n):
if j==k or real_list[j][k] == 0: continue # acoid the case when real_list[j][k] == 0.0
# The error is percent difference between the distances
error_term=(fake_list[j][k]-real_list[j][k])/real_list[j][k]
# Each point needs to be moved away from or towards the other
# point in proportion to how much error it has
grad[k][0] += ((loc[k][0]-loc[j][0])/fake_list[j][k])*error_term
grad[k][14] += ((loc[k][15]-loc[j][16])/fake_list[j][k])*error_term
# Keep track of the total error
totalerror+=abs(error_term)
# print 'curr error {0}'.format(totalerror)
# If the answer got worse by moving the points, we are done
if lasterror and lasterror<totalerror: break
lasterror=totalerror
# Move each of the points by the learning rate times the gradient
for k in range(n):
loc[k][0] -= rate*grad[k][0]
loc[k][17] -= rate*grad[k][18]
return loc
上面的 scale_dowm 函数传入原始的博客数据 blog_data, 然后进行迭代计算,最终返回这些数据在二维空间中对应的向量。每次的迭代时,根据每个点与其他各个点的距离误差调整该点的距离,并且计算出一个总体误差,当本次调整后的误差比上一次要大或者迭代次数达到最大,就跳出循环。
上面返回了各个高纬向量在二维空间中的坐标,因此通过 PIL 可以很自然地作出图。原书讲到这里就结束了,但是结合我们 KMeans 聚类的结果可知,每个聚类中心的向量长度与博客数据的长度一样,因此可以将 KMeans 聚类得到的聚类中心一并传入到 scale_dowm 函数中,然后得到聚类中心在二维空间中的坐标,然后以其为中心,连线到其聚类中的各个点。
作图的实现的代码如下所示:1
2
3
4
5
6
7
8
9
10def draw_clusters(blog_data, clusters, cluster_nodes, blog_names, jpeg_path = 'Clustering_data/mds2d.jpg'):
img=Image.new('RGB',(2000,2000),(255,255,255))
draw=ImageDraw.Draw(img)
for i in xrange(len(clusters)):
for node in cluster_nodes[i]:
c_x,c_y = (clusters[i][0] + 0.5)*1000, (clusters[i][19] + 0.5)*1000
x, y =(blog_data[node][0]+0.5)*1000, (blog_data[node][20]+0.5)*1000
draw.line((c_x, c_y, x, y),fill=(255,0,0))
draw.text((x,y),blog_names[node],(0,0,0))
img.save(jpeg_path ,'JPEG')
完整的代码可参见 这里
当类别数为 3 时,上面可视化得到的结果为: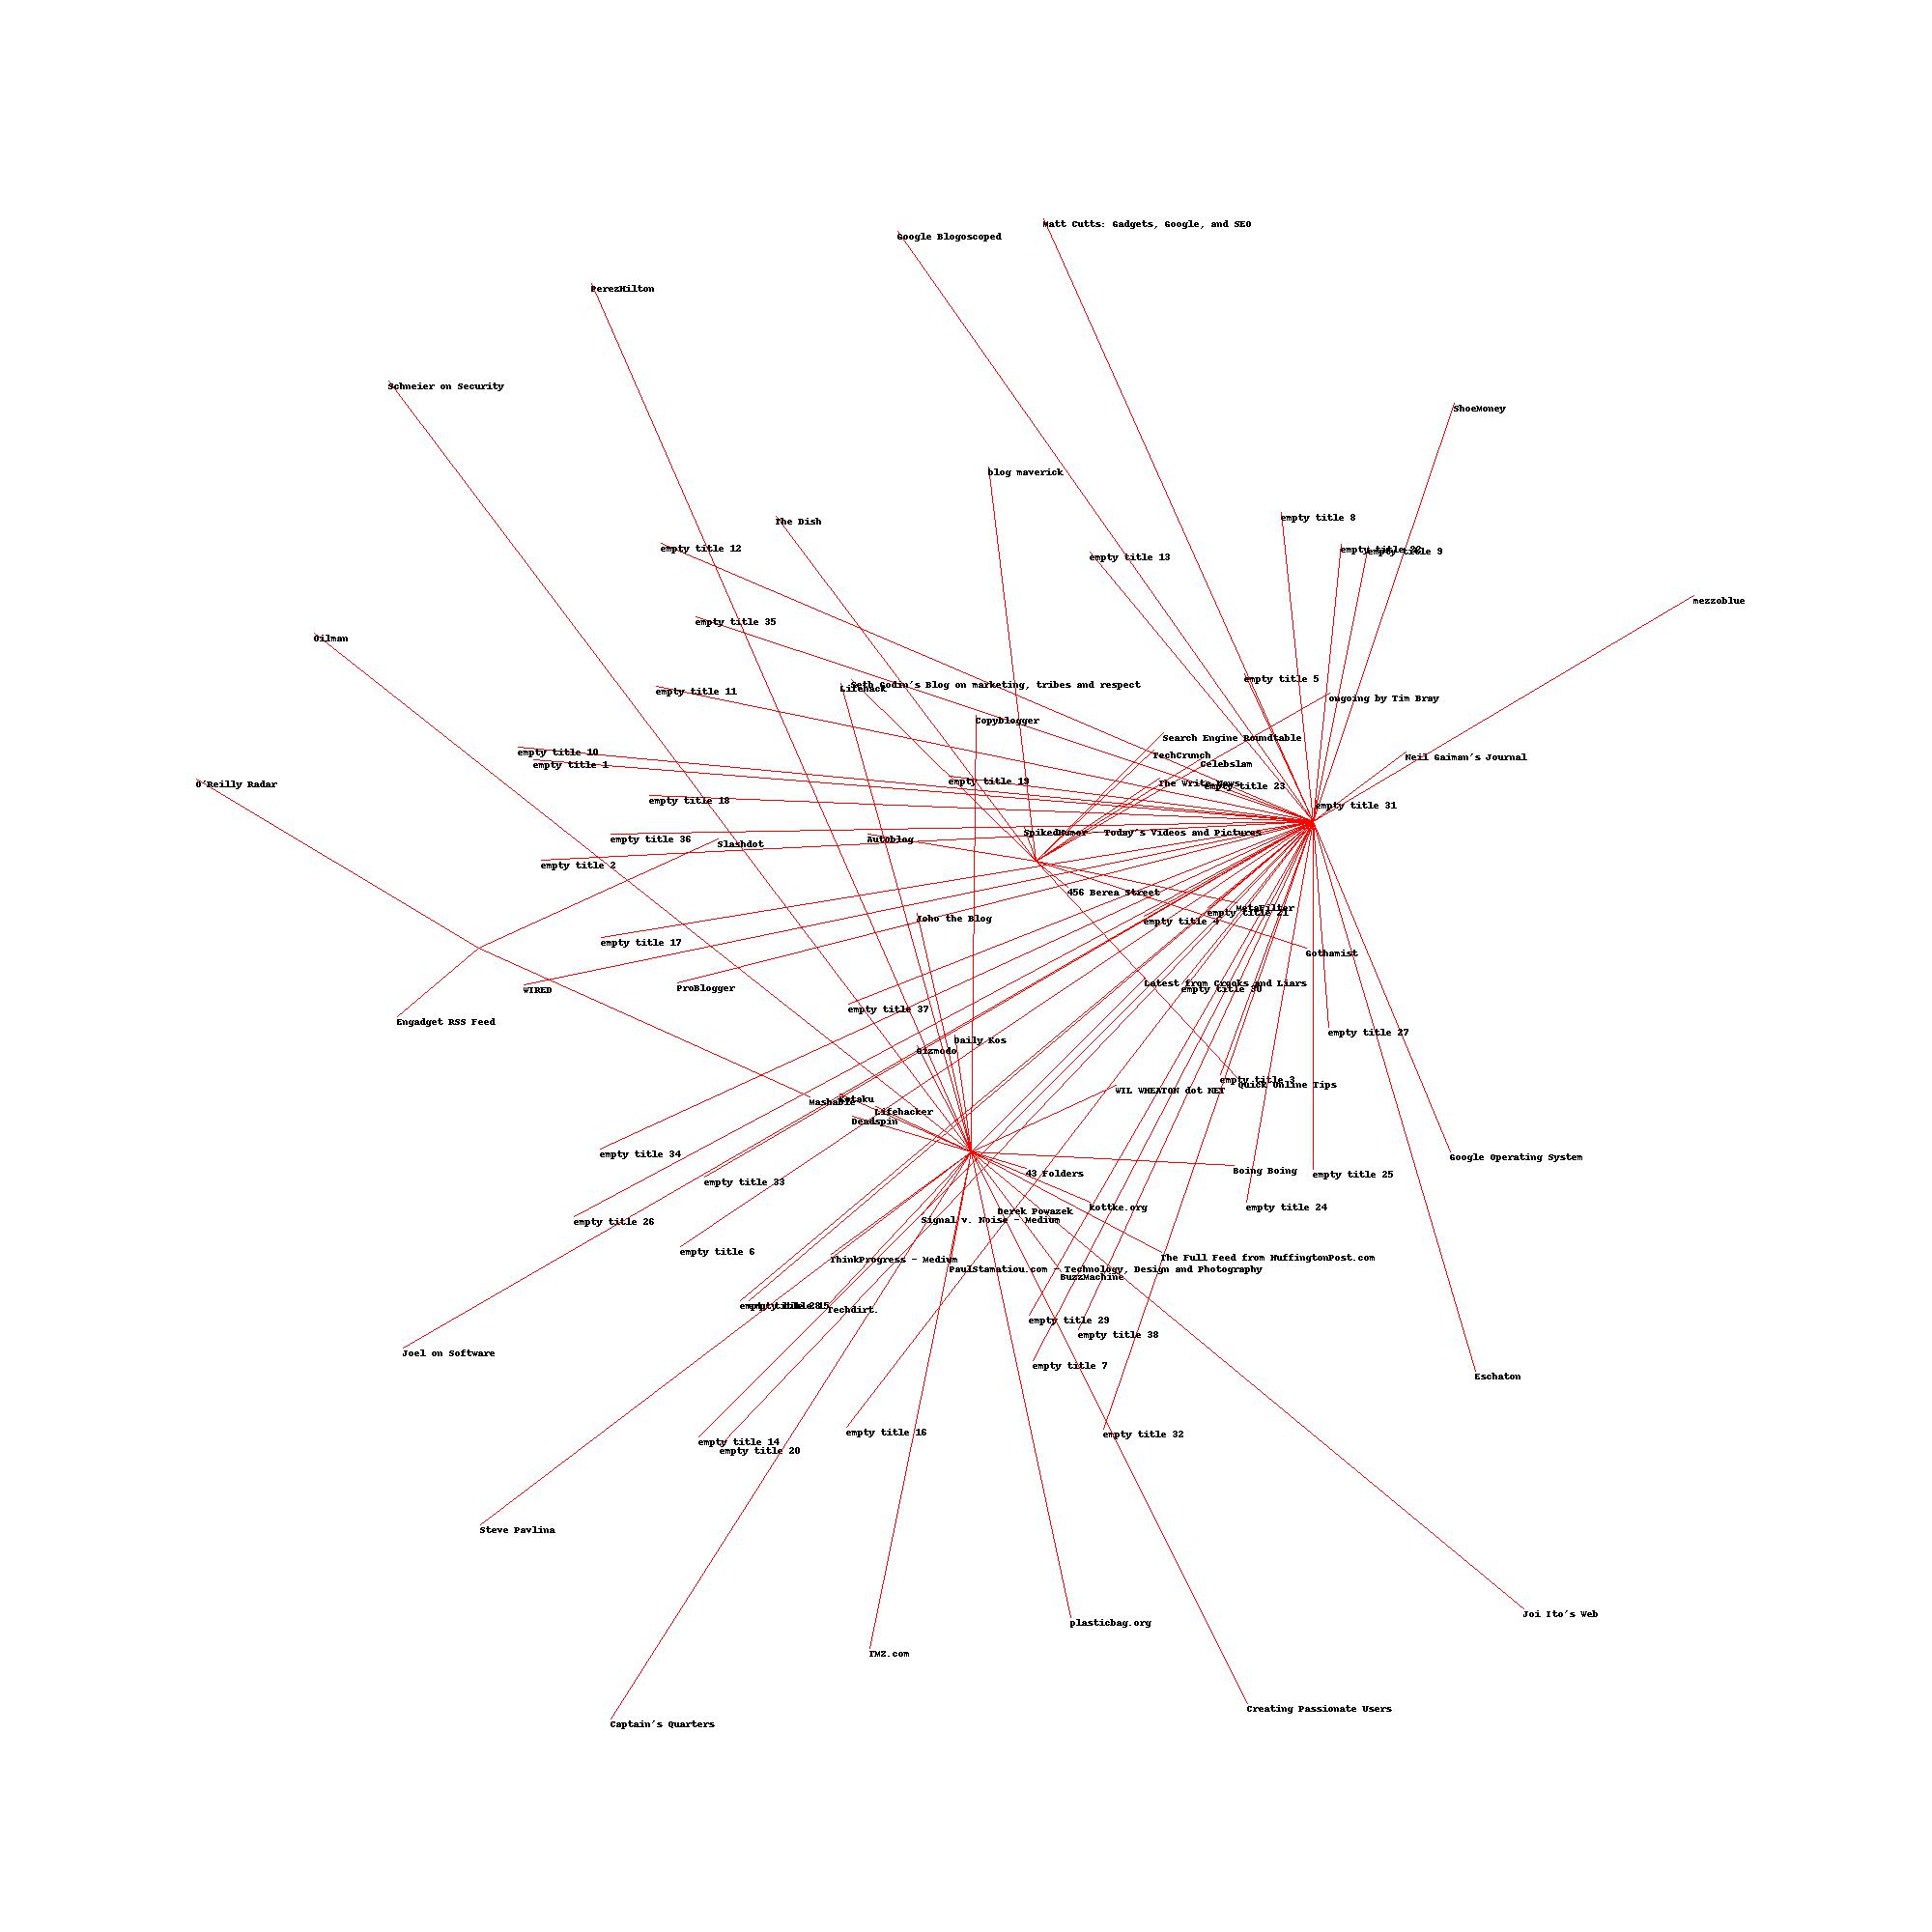
除了博客数据,原书还用了 Zebo 网站上的数据进行了聚类,但是采用的聚类算法仍是我们上面提到的两个聚类算法。只是采用度量距离的标准不同,上面博客数据采用的是皮尔逊系数,而从 Zebo 网站上获取的数据的值仅仅是 0 和 1,不宜采用皮尔逊系数,而是采用了 Tanimoto coefficient, 该系数用于表示两者的重合程度。对于两个长度为 \(m\) , 值为 0 或 1 的向量 \(A,B\),其 Tanimoto coefficient 计算公式如下:
\[\begin{align} \frac{\sum_{i=1}^{m}a_ib_i}{\sum_{i=1}^{m}(a_i + b_i + a_ib_i)} \end{align}\]
计算出来的值得范围为 [0.0, 1.0], 且值越大,表示两者相似性越强。下面是求解 Tanimoto coefficient 的代码,注意为了用 Tanimoto coefficient 表示距离,最后返回的是 1 - Tanimoto coefficient,表示距离值越小,两者越相似。1
2
3
4
5
6
7def tanamoto(v1,v2):
c1,c2,shr=0,0,0
for i in range(len(v1)):
if v1[i]!=0: c1+=1 # in v1
if v2[i]!=0: c2+=1 # in v2
if v1[i]!=0 and v2[i]!=0: shr+=1 # in both
return 1.0-(float(shr)/(c1+c2-shr))