Quantitative Trading:How to Build Your Own Algorithmic Trading Business(1)
“Quantitative Trading: How to Build Your Own Algorithmic Trading Business” by Ernie Chan is a comprehensive guide that explores the world of quantitative trading and provides practical advice for building a algorithmic trading business, especially for individuals interested in quantitative trading.
It covers essential concepts, methodologies, and practical tips to help readers develop and implement their own algorithmic trading strategies while effectively managing risk and building a sustainable trading business.
Due to the significant benefits I received from reading this book, I want to write down some of the most important takeways I get from this book, with the hope that it can also be useful to you.
This passage is about the first four chapters, which introduce basic requirements for independent traders, including search for ideas, perform backtest, and what we need before conducting real trading.
Quantitative trading, also known as algorithmic trading, is the trading of securities based strictly on the buy/sell decisions of computer algorithms.
It relies on advanced mathematical and statistical models, computer algorithms, and data analysis to make trading decisions. It involves the use of quantitative techniques to identify patterns, trends, and opportunities in financial markets and execute trades automatically without human intervention.
The quantitative trading this book focuses on is called statistical arbitrage trading, which deals with the simplest financial instruments: stocks, futures, and sometimes currencies. The book argues that one does not need an advanced degree to become a statistical arbitrage trader, compared to those institutional quantitative traders who received their advanced degrees as physicists, mathematicians, engineers, focusing on trading complex derivative instruments
Independent Quantative Trading
As this book is focus on independent quantitative traders, it lists some demands for anyone who wants to venturing into this field, the most important one I though is the following one
When one plunges into independent trading, fear of losses and of being isolated from the rest of the world is natural, and so it helps to have both a prior appreciation of risks and some savings to lean on. It is important not to have a need for immediate profits to sustain your daily living, as strategies have intrinsic rates of returns that cannot be hurried
The ideal independent quantitative trader is therefore someone who has some prior experience with finance or computer programming, who has enough savings to withstand the inevitable losses and periods without income, and whose emotion has found the right balance between fear and greed.
The book also talks about how much time to take for independent quantative trading, since most people who enter this field aims for freedom of wealth so as to have more time for their lives.And it depends very much on the degree of automation you have achieved. The author lists himself as an example
The largest block of time I need to spend is in the morning before the market opens: I typically need to run various programs to download and process the latest historical data, read company news that comes up on my alert screen, run programs to generate the orders for the day, and then launch a few baskets of orders before the market opens and start a program that will launch orders automatically throughout the day. I would also update my spreadsheet to record the previous day’s profit and loss (P&L) of the different strategies I run based on the brokerages’ statements. All of this takes about two hours.
But the two hours reffered above is just the operational side of the business. If you want to grow your business, or keep your current profits from declining due to increasing competition, you will need to spend time doing research and backtesting on new strategies. But research and development of new strategies is the creative part of any business, and it can be done whenever you want to. And this may take a lot of time
If you are convinced that you want to become a quantitative trader, a number of questions immediately follow, which will be answered in the following chapters
- How do you find the right strategy to trade?
- How do you recognize a good versus a bad strategy even before devoting any time to backtesting them?
- How do you rigorously backtest them?
- If the backtest performance is good, what steps do you need to take to implement the strategy, in terms of both the business structure and the technological infrastructure?
- If the strategy is profitable in initial real-life trading, how does one scale up the capital to make it into a growing income stream while managing the inevitable losses that come with trading?
Fishing for Ideas
This part mainly answers the first question, How do you find the right strategy?
Finding a strategy is not hard, there are hundreds, if not thousands, of trading ideas that are in the public sphere at any time, accessible to anyone at little or no cost. But they may not be useful, especially for academics
The author states in the book that he had found that many strategies described by academics are either too complicated, out of date (perhaps the once-profitable strategies have already lost their power due to competition), or require expensive data to backtest (such as historical fundamental data). Furthermore, many of these academic strategies work only on small-cap stocks, whose illiquidity may render actual trading profits far less impressive than their backtests would suggest.
However, numerous publicly accessible strategies may not be highly rigorous, but one can consider making slight adjustments to these strategies to achieve profitability. For example, the strategies from traders’ forums may have worked only for a little while, or they work for only a certain class of stocks, or they work only if you don’t factor in transaction costs. However, the trick is that you can often modify the basic strategy and make it profitable
Capital Matters
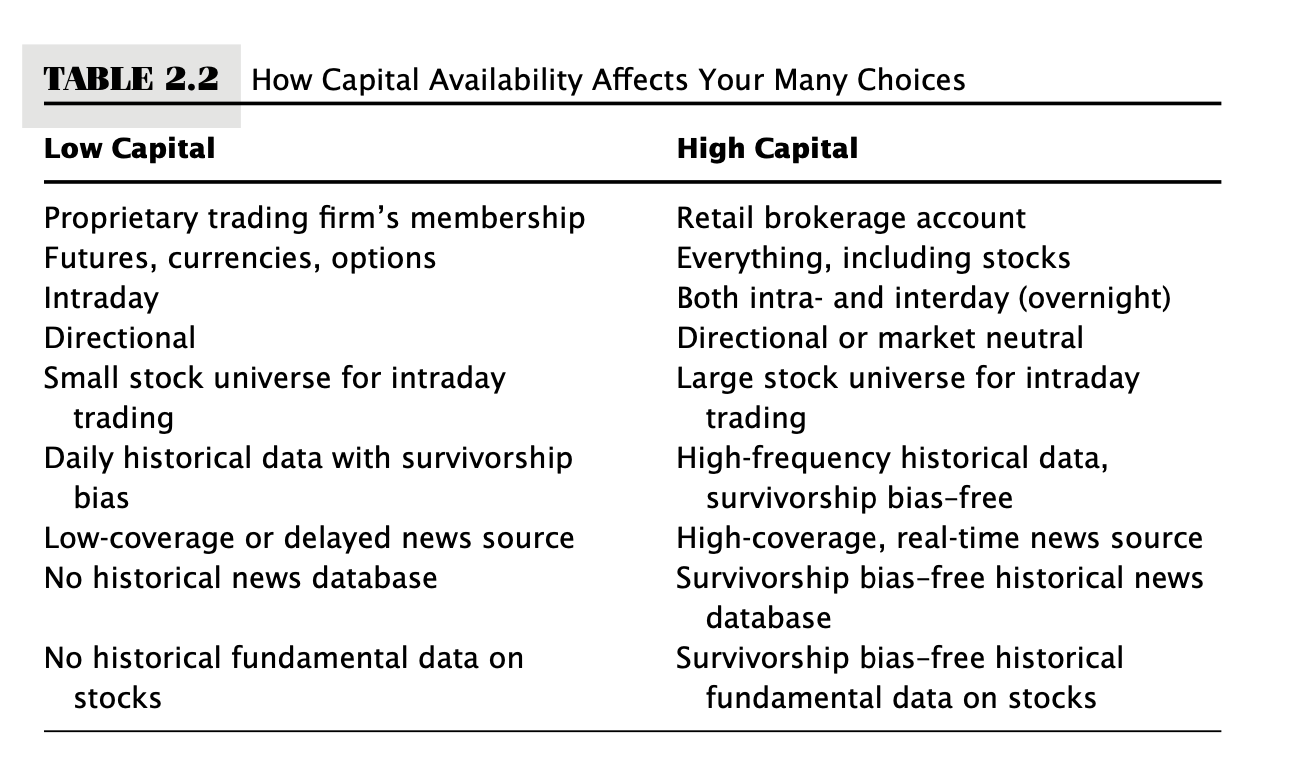
There are many factors to consider to get the most suitable strategy for you, including working hours, programming skills, trading capital, etc. Here we jsut focus on the factor of capital. Because capital availability affects many choices
- account
The first is whether you should open a retail brokerage account or a proprietary trading account, which will be explained with more details in chapter 4
- leverage
With a low-capital account, we need to find strategies that can utilize the maximum leverage available. Trading futures, currencies, and options can offer you higher leverage than stocks; intraday positions allow a Regulation T leverage of 4, while interday (overnight) positions allow only a leverage of 2
Capital (or leverage) availability determines whether you should focus on directional trades (long or short only) or dollar-neutral trades (hedged or pair trades).
A dollar-neutral trades means that hold equal dollar amounts of long and short positions, sometimes it’s also called market neutral strategies, and a dollar-neutral portfolio or market-neutral portfolio requires twice the capital or leverage of a long or short-only portfolio.
- infrastructure
Capital availability also imposes a number of indirect constraints. It affects how much you can spend on various infrastructure, data, and software.
For example, if you have low trading capital, your online brokerage will not be likely to supply you with real-time market data for too many stocks, so you can’t really have a strategy that requires real-time market data over a large universe of stocks.
Similarly, clean historical stock data with high frequency costs more than historical daily stock data. And historical stock data without survivorship bias are much more expensive than those that have such a bias. Yet if your data have survivorship bias, the backtest result can be unreliable.
- holding period
There is a misconception aired by some investment advisers, that is if your goal is to achieve maximum long-term capital growth, then the best strategy is a buy-and-hold one. This notion has been shown to be mathematically false.
In reality, maximum long-term growth is achieved by finding a strategy with the maximum Sharpe ratio (defined in the next section), provided that you have access to sufficiently high leverage. Therefore, comparing a short-term strategy with a very short holding period, small annual return, but very high Sharpe ratio, to a long-term strategy with a long holding period, high annual return, but lower Sharpe ratio, it is still preferable to choose the short-term strategy even if your goal is long-term growth, barring tax considerations and the limitation on your margin borrowing (more on this surprising fact later in Chapter 6 on money and risk management).
A long holding period does not guarantee a good strategy; however, in many cases, it is really hard to judge the market trend correctly, which leads to the truth that long-term approach is more profitable than short-term approach
The following image includes the difference between low capital and high capital
And the autor’s experience may also bring us some insights
I started my life as an independent quantitative trader with $100,000 at a retail brokerage account (I chose Interactive Brokers), and I traded only directional, intraday stock strategies at first. But when I developed a strategy that sometimes requires much more leverage in order to be profitable, I signed up as a member of a proprietary trading firm as well.
Before Backtesting
Even before doing an in-depth backtest of the strategy, you can quickly filter out some unsuitable strategies if they fail one or more of these tests:
- Does it outperform a benchmark?
- Does it have a high enough Sharpe ratio?
- Does it have a small enough drawdown and short enough drawdown duration?
- Does the backtest suffer from survivorship bias?
- Does the strategy lose steam in recent years compared to its earlier years?
- Does the strategy have its own “niche” that protects it from intense competition from large institutional money managers?
We will talk about the above questions one by one
- benchmark
To compare strategy with a benchmark is important, but we also need to realize that different assets require different benchmarks
Everybody seems to know that if a long-only strategy returns 10 percent a year, it is not too fantastic because investing in an index fund will generate as much, if not better, return on average. However, if the strategy is a long-short dollar-neutral strategy (i.e., the portfolio holds long and short positions with equal capital), then 10 percent is quite a good return, because then the benchmark of comparison is not the market index, but a riskless asset such as the yield of the three-month U.S. Treasury bill (which at the time of this writing is about 4 percent).
And Excess Returns = Portfolio Returns − Benchmark Returns
- sharpe ratio and drawdown
Don’t just consider the return rate, Sharpe ratio is also important
There is often a trade-off between the return rate and the sharpe ratio; however, the book suggests that higher Sharpe ratio often leads to higher returns because leverage can be applied to benefit, and the partial risk of leverage can be hedged by the high Sharpe ratio.
If a strategy has deep (e.g., more than 10 percent) or lengthy (e.g., four or more months) drawdowns, it is unlikely that it will have a high Sharpe ratio
Any strategy with a Sharpe ratio less than 1 is not considered a good strategy, and strategies that are profitable every day typically have a Sharpe ratio greater than 3.
- steam and transaction costs
In addition to commission fees, there are also costs incurred due to liquidity; for example, the inability to sell at a specific price or the price drop after selling.
The book explains this point with the following example
when you buy or sell a large chunk of securities, you will not be able to complete the transaction without impacting the prices at which this transaction is done. This effect on the market prices due to your own order is called market impact, and it can contribute to a large part of the total transaction cost when the security is not very liquid
The term “slippage” is used to describe the situation mentioned above, slippage is the difference between the price that triggers the order and the execution price. Of course, this slippage can be of either sign, but on average it will be a cost rather than a gain to the trader
Taking transaction costs into account, the Sharpe ratio of a strategy may shift from positive to negative.
- data
Usually there are two problems related to data, surviveship bias and regime shifts
Survivorship bias in data refers to the exclusion of assets that have already delisted or disappeared from the backtesting data.
Some strategies are significantly impacted by this bias, such as those specifically focus on buying cheap stocks. These strategies may not be targeting undervalued assets, but rather assets that are on the verge of delisting or disappearing.
As to “regime shifts” in the financial markets, it means that financial data from an earlier period simply cannot be fitted to the same model that is applicable today
This point may be hard to swallow for many statistically minded readers. Many of them may think that the more data there is, the more statistically robust the backtest should be. This is true only when the financial time series is generated by a stationary process. Unfortunately, financial time series is famously nonstationary
- fly under the Radar
For personal traders, avoid blindly following strategies of superstitious large institutions; instead, find a well-considered and independent strategy that suits you, or “strategy fly under the Radar”
You should look for those strategies that fly under the radar of most institutional investors, for example, strategies that have very low capacities because they trade too often, strategies that trade very few stocks every day, or strategies that have very infrequent positions
Backtesting
There are many nuts and bolts involved in creating a realistic historical backtest and in reducing the divergence of the future performance of the strategy from its backtest performance.
Issues discussed here include:
- Data: Split/dividend adjustments, noise in daily high/low, and survivorship bias.
- Performance measurement: Annualized Sharpe ratio and maximum drawdown.
- Look-ahead bias: Using unobtainable future information for past trading decisions.
- Data-snooping bias: Using too many parameters to fit historical data, and avoiding it using large enough sample, out-of-sample testing, and sensitivity analysis.
- Strategy refinement: Common ways to make small variations on the strategy to optimize performance.
- Transaction cost: Impact of transaction costs on performance.
Data
There are serveral aspects to which we need to pay attention when dealing with data in backtesting
- Dividend and Split
In the financial field, a dividend refers to a portion of a company’s profits distributed to its shareholders. When a company makes a profit, it can choose to return a portion of the earnings to its shareholders in the form of cash or stock. This is known as a dividend payment. There are two main types of dividends:
- Cash Dividend: A dividend paid by the company directly in the form of cash to its shareholders.
- Stock Dividend: An extra share of stock distributed to shareholders in the form of additional shares.
As to split, a stock split refers to a company dividing its existing shares into a larger number of shares at a certain ratio, thereby increasing the number of shares while reducing the price per share. For example, a 2-for-1 stock split means each share is split into two shares, but the price per share is reduced by half. Stock splits do not change the market value of the company or the total equity of shareholders.
The viewpoint of this book is that we need to refresh the price of the stock when there is dividen or split, according the the exact number of dividen or split
- High and Low Data
A backtest that relies on high and low data is less reliable than one that relies on the open and close.
After retrieving the data from a database, it is often advisable to do a quick error check. The simplest way to do this is to calculate the daily returns based on the data. If you have open, high, low, and close prices, you can calculate the various combinations of daily returns such as from the previous high to today’s close as well. You can then examine closely those days with returns that are, say, 4 standard deviations away from the average.Typically, an extreme return should be accompanied by a news announcement, or should occur on a day when the market index also experienced extreme returns. If not, then your data is suspect
- Survivorship Bias
One way to overcome this problem is to start collecting point-in-time data yourself for the benefit of your future backtest. If you save the prices each day of all the stocks in your universe to a file, then you will have a point-in-time or survivorship-bias-free database to use in the future. Another way to lessen the impact of survivorship bias is to backtest your strategies on more recent data so that the results are not distorted by too many missing stocks.
Performance measurement
The point in this book is that sharpe ratio and drawdowns are the two most important measurements in backtesting.
But usually it did not include average annualized returns, the measure most commonly quoted by investors. The reason in the book is if you use this measure, you have to tell people a number of things about what denominator you use to calculate returns.
In general, if you calculate your average and standard deviation of returns based on a certain trading period T, whether T is a month, a day, or an hour, and you want to annualize these quantities, you have to first find out how many such trading periods there are in a year (call it NT). Then Annualized Sharpe Ratio = (NT) × Sharpe Ratio
Common Pitfalls
These pitfalls are actually some common problems in machine learning
Look-Ahead Bias: same as the problem of data leakage in machine learning
Data-Snooping Bias: same as the problem of overfitting in machine learning, the author offers his experience as follows
Usually, an erroneous backtest would produce a historical performance that is better than what we would have obtained in actual trading
As a rule of thumb, I would not employ more than five parameters, including quantities such as entry and exit thresholds, holding period, or the lookback period, in computing moving averages.
Let’s assume that the number of data points needed for optimizing your parameters is equal to 252 times the number of free parameters your model has.(purely on experience.)
- Sensitivity Analysis: to test if a strategy if robust
Once you have optimized your parameters as well as various features of your model and have verified that its performance on a test set is still reasonable, vary these parameters or make some small qualitative changes in the features of the model and see how the performance changes on both the training and the test sets.
Transaction Costs
In actual financial trading, there are various costs involved, like commission, liquidity cost, opportunity cost, market impact, and slippage, which we had reffered in the previous chapter
These costs can greatly impact the final returns in backtesting.And it should not surprise you to find that a strategy with a high Sharpe ratio before adding transaction costs can become very unprofitable after adding such costs
So you should consider transaction costs in backtesting
Strategy Refinement
Usaually there are some very simple strategies that are fairly well known in traders’ circles and are still somewhat profitable, though their returns seem to be diminishing. An example is the pair trading of stocks. The reason they are diminishing in returns is that too many traders are taking advantage of this arbitrage opportunity and gradually erasing the profit margin. However, it is often possible to introduce minor variations in the basic strategy, which will boost its returns.
These minor variations are often far less well known than the basic strategy, and therefore far less well exploited by traders. Sometimes they involve excluding certain stocks or groups of stocks from the universe. For example, traders often prefer to exclude pharmaceutical stocks from their technical trading program because of the dramatic impact of news on their prices, or else they may exclude stocks that have pending merger or acquisition deals. Other traders change the entry and exit timing or frequency of the trades. And a strategy that has a very good Sharpe ratio when it is applied to small-cap stocks becomes very unprofitable when applied to large-cap stocks.
When introducing these refinements to your strategy, it is preferable that the refinement has some basis in fundamental economics or a well-studied market phenomenon, rather than some arbitrary rule based on trial and error. Otherwise, data-snooping bias looms.
Setting up your business
Retail or Proprietray
Proprietary trading firms are financial companies specialized in proprietary trading. This means they use their own capital for trading, aiming to profit from market fluctuations. These firms typically have highly specialized trading teams that employ complex trading strategies. They use their own funds for trading, enabling them to seek profits in high-risk, high-return markets.
Retail brokerage accounts are accounts opened by individual investors with a brokerage or securities firm. Through retail brokerage accounts, individual investors can buy and sell financial products such as stocks, bonds, and funds. These accounts are typically geared towards the general public and offer relatively simple investment options and trading functionalities. The funds in these accounts come from the individual investors themselves and are used to meet their personal investment needs.
Their difference are listed as follows in this book
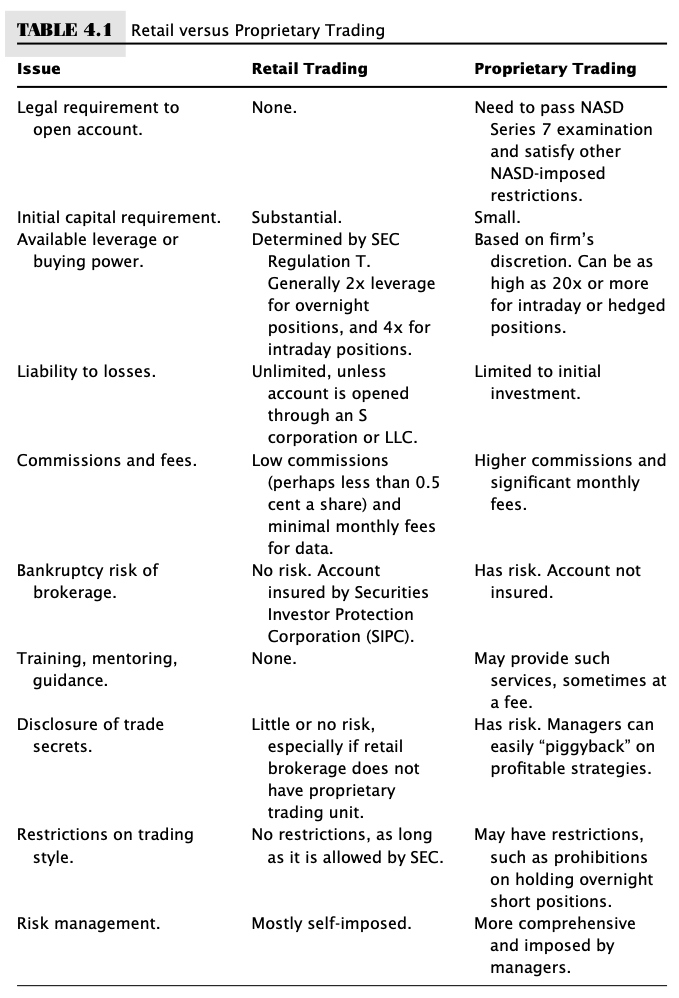
In a nutshell, retail brokerages give you complete freedom and better capital protection but smaller leverage, while proprietary trading firms give you less freedom and less capital protection but much high leverage. You can choose to have both retail and proprietary accounts, each tailored to the specific needs of your strategies
The decision whether to go retail or to join a proprietary trading firm is generally based on your need of capital, the style of your strategy, and your skill level.
For example, if you run a low-risk, market-neutral strategy that nevertheless requires a much higher leverage than allowed by Regulation T in order to generate good returns, a proprietary account may be better for you. However, if you engage in high-frequency futures trading that does not require too much capital, a retail account may save you a lot of costs and hassles. Similarly, a very experienced trader with strong risk man- agement practices and emotional stability probably doesn’t need the guidance given by a proprietary firm, but less experienced traders may benefit from the imposed restraints.
Regardless of whether you have chosen to trade in a retail bro- kerage or join a proprietary trading firm, you need to make sure their trading account and systems have these features:
- Relatively low commissions.
- Trade a good variety of financial instruments.
- Access to deep pool of liquidity.
- API for real-time data retrieval and order transmission.
A “deep pool of liquidity” refers to a financial market or trading environment where there is a significant volume of buy and sell orders available for a particular asset (such as a stock, currency, or commodity) at various price levels. In other words, it is a market with a large number of participants willing to trade that particular asset, resulting in a high level of trading activity.
Physical Infrastructure
In quantitative trading, high-performance servers and reliable network connections are critical because they directly affect the efficiency of executing trading strategies and the stability of trades.
Here are some aspects that need to be cosidered in this part
Server Selection: Quantitative trading requires the use of high-performance servers, typically servers with powerful processing capabilities and large memory capacity. These servers need to process market data rapidly, run complex trading strategies, and execute trade instructions efficiently.
Low Latency: The success of quantitative trading often relies on quick execution and response times. Therefore, servers need to have low latency characteristics to ensure that trade instructions reach the exchange and receive a response as quickly as possible, reducing the impact of network latency on trade slippage.
Redundant Systems: As quantitative trading involves high-frequency, automated trading, server reliability is crucial. Redundant systems, such as redundant power supplies, redundant hard drives, and redundant network interfaces, are used to prevent single points of failure and ensure the continuous operation of servers.
Server Location: Server location is also an important consideration. To minimize trade execution latency, some quantitative traders place servers in data centers close to the exchange, reducing the transmission time of trade instructions as much as possible.
Network Connectivity: High-speed and stable network connections are crucial for quantitative trading. Quantitative traders often choose high-quality dedicated network connections or leased lines to ensure fast and reliable data transmission.
Security: Quantitative trading involves a significant amount of trade data and sensitive information. Therefore, servers and network infrastructure need to have robust security measures to protect traders’ data and funds.
The above requirements may seem too strict for the trading which frequency is relatively lower, since it is usually for ultra-high-frequency trading applications. But some infrastructure is still required to support the development and execution of trading strategies. For example, server, network ans security, and it highly depends on what kind of trading you’re performing.
Summary
In summary, this passage discusses various aspects of quantitative trading and provides practical advice for building an algorithmic trading business. It emphasizes the importance of strategy selection, backtesting, and setting up the necessary infrastructure. Here are the key points covered:
Quantitative Trading Overview and Independent Quantitative Trading: Quantitative trading, also known as algorithmic trading, uses computer algorithms, mathematical models, and data analysis to make buy/sell decisions automatically. The ideal independent quantitative trader should have some prior experience in finance or computer programming, sufficient savings to withstand losses, and emotional balance between fear and greed.
Finding Trading Ideas: Traders can find trading strategies from various sources, but it is essential to verify and refine them. Minor adjustments to existing strategies can lead to profitable results. Factors Influencing Strategy Selection: Capital availability, infrastructure, and holding period influence the choice of trading strategy.
Backtesting: Backtesting involves testing a strategy’s performance using historical data.Considerations include dividend/split adjustments, data accuracy, perfromance measurements, transaction costs, and sensitivity analysis.
Setting Up Your Business: Traders can choose between retail brokerage accounts and proprietary trading firms. Important features to consider include low commissions, access to a variety of financial instruments, deep liquidity, and real-time data retrieval and order transmission. And traders also need for set up some physical infrastructure for real trading.