Systematic Trading-Avoid Flawed Human Brain with Systematic Trading Rules
《Systematic Trading: A unique new method for designing trading and investing systems》 is a comprehensive guide for traders and investors seeking a structured approach to the markets.
Aimed at both novices and experienced traders, the book offers practical insights and applications, making it a pretty good resource for anyone looking to enhance their trading methodology with a systematic approach.
This is not a book totally about automating trading strategies. It’s possible to trade systematically using an entirely manual process with just a spreadsheet to speed up calculations, so automation is not necessary, the key word if "systematic". This passage mainly covers the first two chapters, providing a rough overview of this book. Hope you can enjoy it
Flawed Human Brain
Three types of traders
There are three types of traders in this book. To a certain extent, these three types are determined and classified by the degree of automation with which they execute transactions.
1. asset allocating investor
Asset allocators can use systematic methods to avoid the short-term chasing of fads and fashions that they know will reduce their returns. They might be lazy and wise amateur investors, or managing institutional portfolios with long horizons such as pension funds.
Asset allocators are sceptical about those who claim to get extra returns from frequent trading. For this reason the basic asset allocation principle assumes you can’t forecast how asset prices will perform.
2. semi-automatic trader
Semi-automatic traders think they are superior to simple rules when it comes to forecasting by how much prices will go up or down; instead they make their own educated guesses
They would like to place those bets inside a systematic framework which will ensure their positions and risk are properly managed. This frees them up to spend more time making the right call on the market.
3. staunch systems trader
The staunch systems trader is a true believer in the benefits of fully systematic trading. Unlike the semi-automatic trader and the asset allocating investor, they embrace the use of systematic trading rules to forecast price changes, but within the same common framework for position risk management.
Avoid mistake instead of silver bullet
This book claims that there is no magic system that will automatically make huge profits for you, and you should be wary of anyone who says otherwise, especially if they want to sell it to you.
Instead, success in systematic trading is mostly down to avoiding common mistakes such as over complicating your system, being too optimistic about likely returns, taking excessive risks, and trading too often.
The aim of this book isn’t just to offer a single predefined system for trading, but to provide a modular framework which can be adapted to meet your needs. Part three describes the framework in detail. Just like you can choose different engines and tyres on a car, my framework includes options for different trading rules and position sizing calculations.
Overconfidence leads to flawed human brain
Meddling is due to the biggest cognitive bias of all: overconfidence. We think we are cleverer than the trading system and we are. To stop meddling with our trading systems we require what economists call a commitment mechanism.
Creating a purely objective system is a powerful commitment mechanism.
A highly subjective rule would be something like ‘Sell for small losses, and hold on to large profit making positions’.
Another advantage of objective systems is that they can be automated, and automation is a good commitment mechanism
But automation doesn’t stop meddling, having a system which requires a human to do the actual execution of automatically generated trades is still prone to meddling, so it must be done with a well designed system in which you have full confidence.
One simple principle is systems whose performance and behaviour can be explained will be more preferred, while there are some pitfalls to avoid when designing trading systems: over-fitting, overtrading and over-betting
- over-fitting
If we’re not careful the rules selected will fit the data too well. They will be highly tuned to one set of market conditions and perform worse in actual trading than a simpler rule would.
- overtrading
Both amateur investors and professional managers have a tendency to trade too frequently.There are extra costs involved in trading more often.
Overtrading suggests overconfidence in your own relative ability to overcome the higher hurdle of bigger costs.
- over-betting
If your confidence is unbounded you can bet the maximum that your broker allows you to. Potentially this could be a ten-fold leverage on an individual equity bet, equating to an annual standard deviation of returns of around 200%.
Systematic Trading Rules
This section mostly relates to how trading rules are fitted. This is less applicable to asset allocating investors and semi-automatic traders
Ideas first or data first
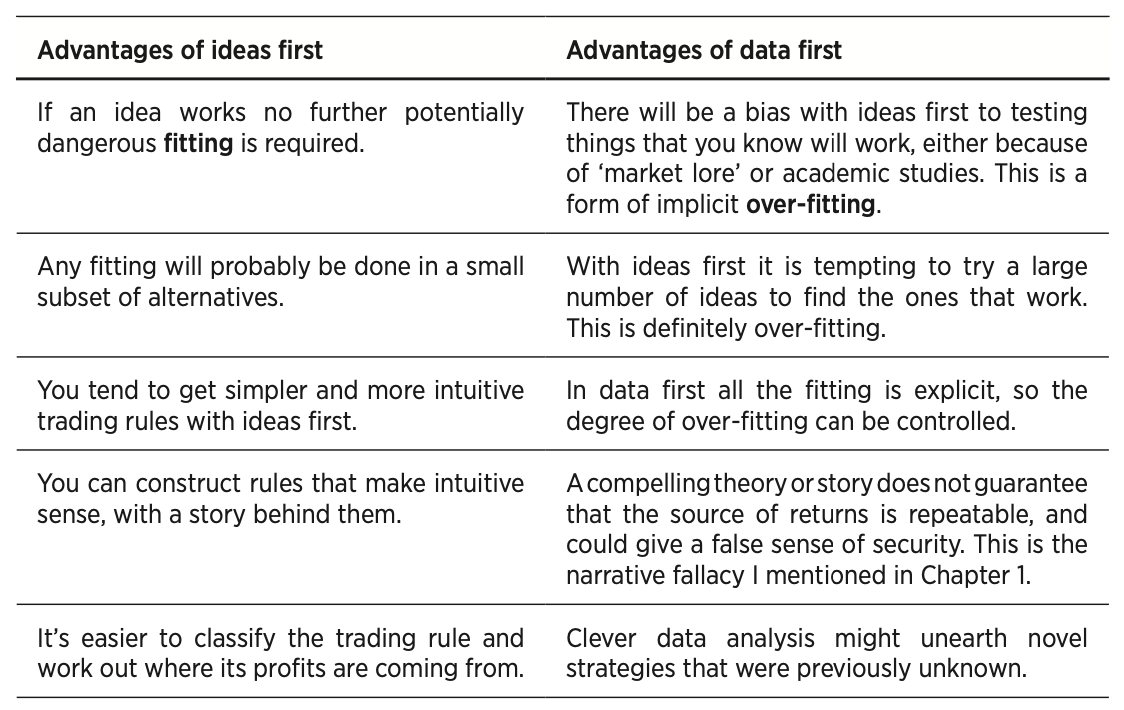
The author favors the ideas first method. This usually results in intuitive, simpler and more transparent rules. In the author's experience, consistently profitable trading comes out of careful research, done by thoughtful and knowledgeable people, who seek to understand where their profits come from.
But some situations the data first process could be better; for example in high frequency trading where there is plenty of data, rules can be refitted regularly and novel ideas are more likely to be found as market structure evolves.
What makes a good trading rule
This book identifies the following four aspects as the most crucial:
- explainable profits
With an ideas first approach you can easily explain why a strategy was profitable, since the explanation is inherent in the original idea. For example you might have tested a trend following rule, which you think makes money because of cognitive biases explained by prospect theory.
With data first any explanation has to follow the fitting process. You first examine how a rule behaves and then infer what might be causing the effect. The more complex a data driven trading rule is the harder it will be to explain.
Remember the narrative fallacy, another cognitive bias: humans like stories. To trust a trading rule the author both a good story and a rigorous back-test.
- intuitively understandable behaviour
A complicated system might buy or sell when prices moved higher, depending on the exact pattern. This would make its behaviour less obvious and more unpredictable.
- as simple as possible
It is much easier to explain the profitability and behaviour of simple trading rules, those with few moving parts and no weird interactions.
Ideas first rules should be simple unless you begin with a very convoluted idea, or over complicate it to get a more profitable back-test, neither of which is recommended. Data first rules can be very simple or extremely complicated, depending on how many parameters are fitted. A data first rule with more parameters will be less explainable, and more vulnerable to over-fitting.
- can be systematised
Ideas need to translated into systematised rules. Not all styles of trading are entirely suitable for this, because they are inherently subjective or because of data limitations.
- subjective
Many methods of trading cannot be systematised because it’s impossible to write down a set of relatively simple, objective and generic rules. One example would be merger arbitrage, where you have to assess the likelihood of a deal going through based on analysis of a number of hard to quantify factors.
- data limitations
Even if a strategy is objective the necessary data might be unavailable. Even if you could write trading rules for merger arbitrage the necessary information about legal and regulatory issues cannot easily be converted into an algorithm friendly format.
There might also be a shortage of data, cause many years of data are needed to properly test a strategy.
Why certain rules make profit
This book lists multiple cases to explain why certain rules are profitable
risk premia
liquidity and size
when others have to trade
barriers to entry, returns to effort and cost
behavioural effects
pure alpha and skill
...
risk premia
There are three types risk premia mentioned in this book
- persistent risk premium
Some risk premia persist for long periods, like the extra return you’d expect from investing in equities versus safer assets like bonds.
- timing varying risk premium
You can make profits buying cheap premia and selling expensive ones. This is a form of mean reversion trading, where you assume premia, and hence prices, will revert to some long- term equilibrium.
- skew and unlikely events premium
The rational investor of classical financial theory only cares about an asset’s Sharpe ratio (SR) – it’s average returns adjusted for their standard deviation.(Formally it is the mean return for a particular time period divided by the standard deviation of returns for the same time period; daily v.s annual)
This only makes sense if all assets have symmetrically distributed returns.in practice assets with the same SR could make steady losses with occasional large returns or steady gains with occasional large losses
- positive skew VS negative skew
When an asset has a higher chance of a large down move than an equivalent up move, it is said to have a negative skew. If large up moves are more likely then it has positive skew.
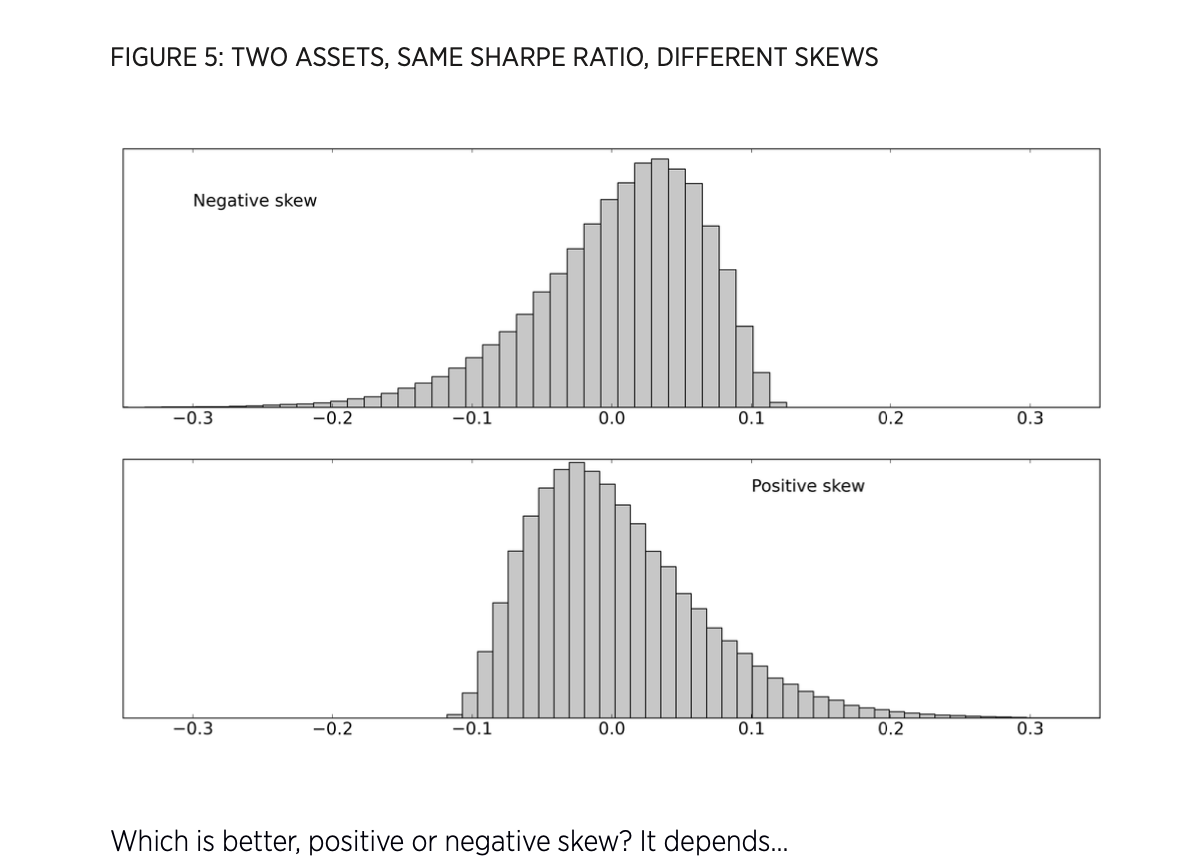
With the same Sharpe ratio, the returns from a positively skewed asset will contain more losing days than for those of a negatively skewed asset. But the losing days will be relatively small in magnitude.
Equities normally have mildly negative skew. ‘Safe haven’ assets like gold and Swiss francs tend to have positive skew.
- liquidity and size
The degree of liquidity in an asset is how easily we can buy or sell without unduly affecting the price.
The premia for liquidity, size and leverage can vary over time, presenting opportunities for well timed buying and selling.
- when others have to trade
Not everyone trades because they are trying to make money. Some are forced to.
A foreign exchange carry trading rule that borrows in low interest rate currencies like Switzerland and invests in high interest rate currencies will be consistently profitable as a result, at least until the currency policy is abandoned
- barriers to entry, returns to effort and cost
Some trading rules have barriers to entry in the form of costs or investments that need to be made to realise profits from them. High frequency strategies require renting expensive servers located physically within exchange buildings, as well as developing specialised software.
If an opportunity requires a lot of work to exploit, then it may be passed up by most investors and additional returns would not be available.
- behavioural effects
You can create rules which extract returns from other people’s behavioural weaknesses.
- pure alpha and skill
Those who exhibit pure skill can adapt to changing market opportunities in a way that a systematic rule never could. If you think you are part of this elite group then the semi- automatic trader example is for you.
Trading styles
static vs dynamic
Static means you invest your portfolio and then do nothing, while dynamic is to rebalance your protfolio the from time to time
The most intuitive dynamic rule is to re-balance your portfolio so you keep the same cash value in each company.
Yet another rebalance rule is to equal risk instead of equal cash value, which is risk parity investing. This method assumes risk is equal to the recent standard deviation of the daily percentage changes in price for each firm.
Risk parity is an advanced portfolio technique often used by hedge funds and sophisticated investors. It requires a complex quantitative methodology, which makes its allocations more advanced than simplified allocation strategies. The goal of risk parity investing is to earn the optimal level of return at the targeted risk level.
Simplified allocation strategies such as the 60%/40% stocks-bonds portfolio make use of MPT. MPT provides a standard for diversification within one's investment portfolio that maximizes expected return for a given level of risk. In simplified MPT strategies using just stocks and bonds, allocations are usually more heavily weighted toward equities for investors who wish to take on more risk. Risk-averse investors will instead have a higher weight in bonds for capital preservation.
- predictable risk vs unpredictable risk
It’s very hard to forecast what the return will be each day over the next few weeks for an asset or portfolio. But you can model and estimate what the variation in returns is likely to be. Estimates based entirely on assuming that recent levels of variation will persist tend to be relatively good
skew: positive vs negative
The term "skew" mentioned here, just like the "skew" referred to in the context of risk premium earlier, which usually can be classified into positive skew and negative skew
If you are using a systematic trading rule and have access to back-testing technology you can measure your skew. Otherwise you will need to make a judgment on what it is likely to be based on your trading style.
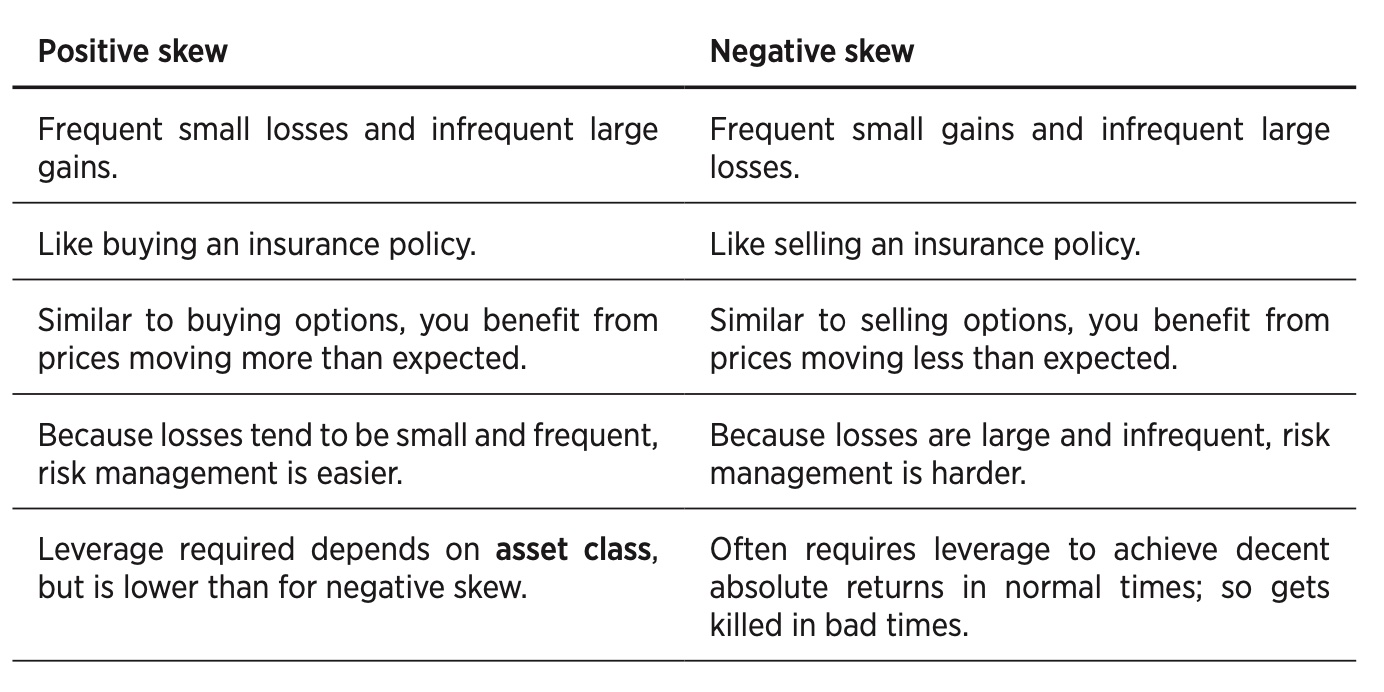
The characteristic of positive skew and nagative can be listed as follows
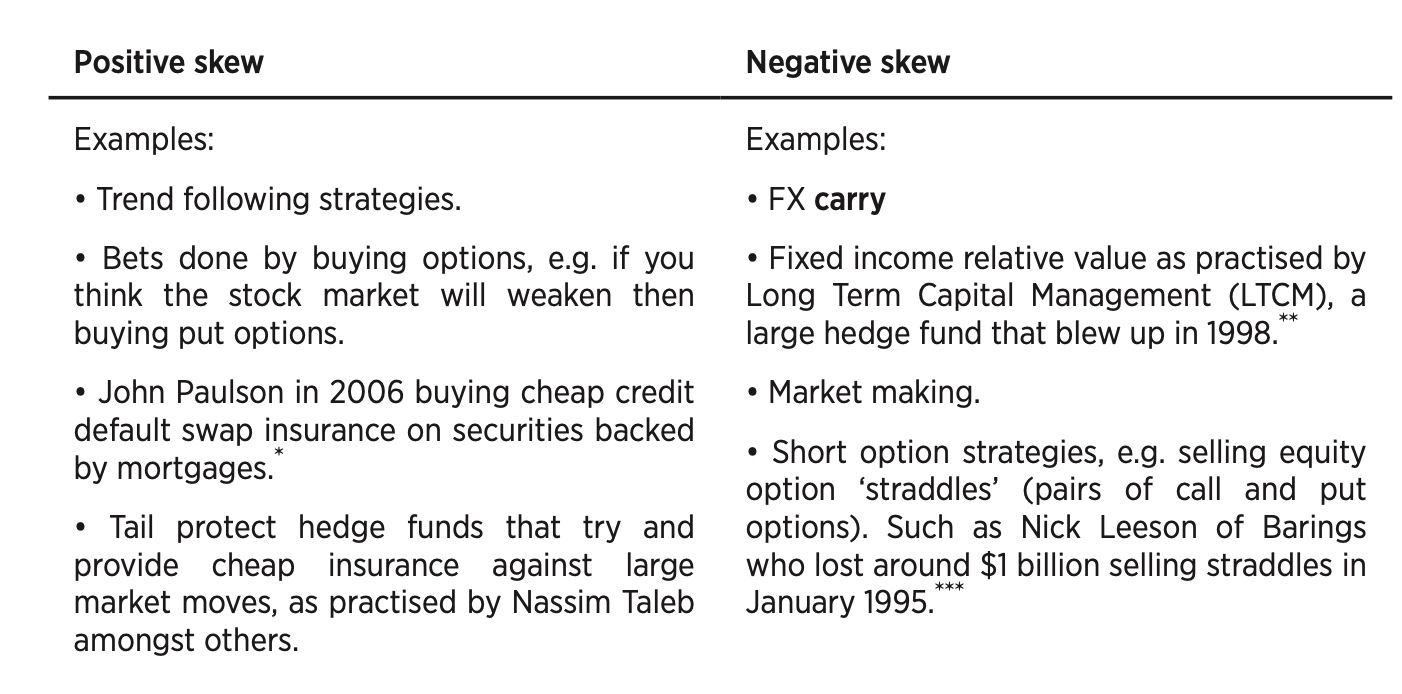
Some examples of positive skew and negative skew
Be aware that if you are making steady profits nearly every day, and most of your trades are winners, then there is a good chance you are engaged in negative skew trading. It’s just that you haven’t yet seen any rare large losses.
trading speed: fast vs slow
Trading speed can be roughly classified into three types: very slow, medium and fast, depends on the average holding period
Very slow systems usually hold assets for several months to many years. While the average holding period of medium is usually a few hours or days, to several months. But for fast system, the holding period is usually microseconds to one day
Very slow systems look almost like static portfolios, with additional gradual changes in position coming from their trading rules. Rules often involve mean reversion to very long run equilibrium such as relative value equity portfolios that buy past losers, and sell recent winners.
In medium systems, trading costs need to be accurately measured to decide whether an instrument should be traded at a faster or slower speed within this region. Large institutional traders also need to determine if a market has the capacity to absorb their trading. These subjects will be covered in chapter twelve, ‘Speed and Size’.
For fast system, typical raw Sharpe ratios could be very high due to the number of trades made, but costs will chew up a big chunk of profits. Special execution algorithms are needed to reduce costs below normal levels. There are higher barriers to entry than at slower speeds; co-located servers and fully automated software is needed. Also faster strategies are likely to have limited capacity. The domain of high frequency trading mostly falls outside the scope of this book.
- LAW OF ACTIVE MANAGEMENT
There is a law called LAW OF ACTIVE MANAGEMENT, which states that the Sharpe ratio of a trading strategy will be proportional to the square root of the number of independent bets made per year.
This law gives us some idea of how profits should vary with trading speed. Suppose you’re holding one asset at a time, and making one ‘bet’ per year (buying, holding for 12 months before selling, then repeating), and that you expect an SR of 0.15 from this activity.
If you decide to make four ‘bets’ a year, holding the asset for three months, then because 2 is the square root of 4 you should expect an SR of 2 × 0.15 = 0.30.
If you begin betting every single business day, then with around 256 business days in a year the SR will be 16 times larger than 0.15 or 2.4
The other important implication of the law is that diversification across assets can substantially improve returns. If you can find four assets which have zero correlation then you can double your Sharpe ratio.
But the flaws of this law is also obvious, it assumes that the ‘skill’ of the trader is constant across holding periods (but the skills required to day trade are very different from those a long-term investor needs). It also ignores transaction costs;these can seriously damage the returns of fast traders
### technical vs fundamental
Strategies vary in the source of data they use, either using technical or fundamental information, or both.
Purely technical rules only use price data. While fundamental data, comes in two main flavours: micro and macro. Micro data is about a specific asset, for example the yield of a particular bond or the PE ratio of a company. Macro data such as inflation and GDP growth covers entire economies.
Technical systems are easier to build and run, but in another example of barriers to entry the additional effort required for including fundamental rules is usually rewarded with higher returns. The examples in this book are all technical
portfolio sizep
As the law of active management shows that diversification is the best source of additional risk adjusted returns. Both traders and investors should hold more positions when they can; ideally across several asset classes to get the greatest possible benefit. With larger portfolios you’re also less exposed to instrument specific problems such as bad data or temporary liquidity issues.
However smaller portfolios make sense for semi-automatic traders or for those running entirely manual systems. In chapter twelve, ‘Speed and Size’, those with relatively small accounts also have to limit the number of positions they take.
leverage: more risk and yet more skew
Leverage is borrowing to invest or trade. The borrowing can be explicit as when trading equities on margin, or implicit as with derivatives like futures. Usually one needs leverage when the natural return and risk of an asset is less than desired.
For example, if you want a 10% return on average, and your asset is a bond with an expected Sharpe ratio of 0.5, but only a 5% annualised standard deviation, then you need to lever up four times
Leverage can be dangerous, especially for negative skew, where we gain small consistent gains until the trade goes terribly wrong. These steady gains tricked you into thinking that the position was low risk, and lured you into using leverage to improve your returns. So be aware of gearing up on apparently low risk with an asset or with a style of trading which is likely to have negative skew, even if you haven’t yet seen any evidence of the large downside
contrarians, market followers and crowded trades
Three types of trades: contrarians, market followers and crowded trades
Mean reversion and relative value traders act as contrarians, they seek to take advantage of mis-pricing which means buying low after falls and selling when the price has risen. Contrarian traders like to catch falling knives.
Market followers usually prefer various forms of trend following. Trend followers will close positions that have started to lose money, like the early loss taker trading rule.
When the majority of market participants have the same bet on, which could be from behaving as contrarians or market followers.As the story goes when the shoeshine boy or the taxi driver is in the market, it’s time to get out, cause the market if full of
crowded trades.
Achievable Sharpe ratios
It’s important to have a realistic sense of what level of Sharpe ratios (SR) are achievable. Inflated expectations can lead to over betting, which will be discussed more in chapter nine, ‘Volatility Targeting’ and overtrading
The simplest possible risky investments, is a long only equity position in one company, excess equity returns on single equities will probably average around 3% a year in the future; with annualised standard deviation of around 20%, this implies an SR of 3% ÷ 20% = 0.15 is realistic
With the law of active management, investing in a portfolio of equities will do slightly better. If you invest globally across multiple countries you can probably get to a Sharpe ratio of around 0.25
To do much better you’d need to allocate across multiple asset classes: equities, bonds, commodities and so on. Since correlations between asset classes are usually low, a portfolio covering several of these types of assets can probably expect to reach a Sharpe ratio of around 0.40
Many traders have highly unrealistic expectations of back-tested Sharpe ratios of 2.0, 3.0 or even higher; just on single instruments! These values are far too optimistic and are caused by over-fitting. In reality SR consistently greater than 1.0 are rarely achieved, even by sophisticated institutional investors.
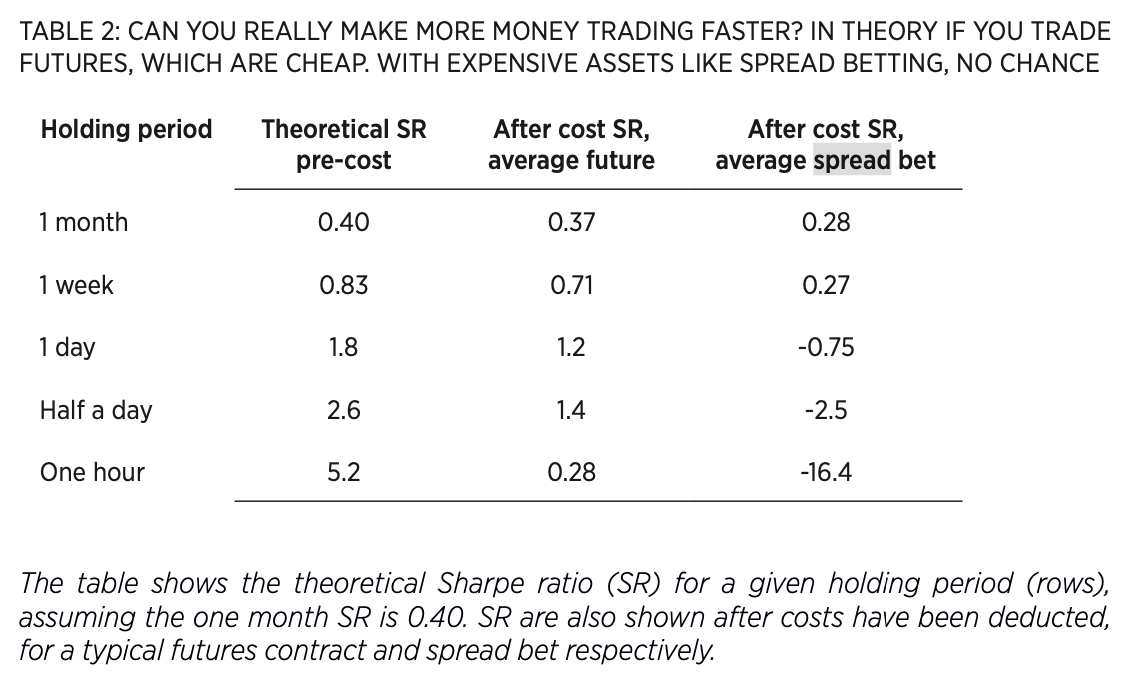
Usually there are two ways to increase SR, (1) trade negative skew strategies (2) trade more quickly
Howerever, taking into account the cost of each trading, trading more quickly may not lead to high SR, as show in the image below
Conslusion
This passage roughly talks about how to avoid flawd human brain with systematic trading rules, which empahsizes why we need trading rules, and how to measure whether rules are good or not. Different types of traders and trading styles are also introduced in this passage, showing those various factors that will affect your profits
It’s important that you understand and can cope with the risks of your trading system. Finding the best trading rules is less important than designing your trading system in the correct way. A balanced combination of trading rules, with different styles that work in different environments, is better than any single alternative.