ROC Curve and PR Curve
ROC curve and PR curve are two important curves for evaluating machine learning algorithm performance. Their concepts are easily confused, but their usage scenarios differ. This article explains the meaning and application scenarios of both curves.
Definitions
ROC curve and PR curve are both used in binary classification and involve the following concepts (from The Relationship Between Precision-Recall and ROC Curves):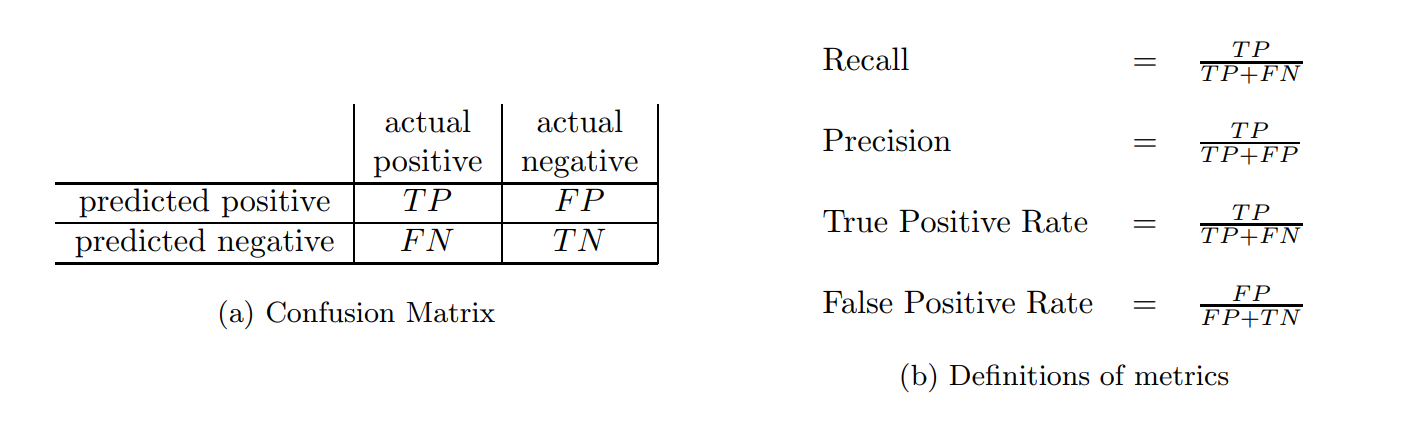
The four metrics in plain terms:
- Recall: The proportion of positive samples correctly predicted as positive (higher is better)
- Precision: The proportion of predicted positives that are actually positive (higher is better)
- True Positive Rate: Same definition as Recall (higher is better)
- FPR: The proportion of negative samples predicted as positive (lower is better)
For a binary classification problem, we typically set a threshold. When the predicted value exceeds this threshold, we predict positive; otherwise negative. If we plot Recall on the x-axis and Precision on the y-axis, each threshold gives a point, and multiple thresholds form a curve—the PR curve.
PR curve has Recall on x-axis and Precision on y-axis; ROC curve has FPR on x-axis and TPR on y-axis.
What’s the relationship between them?
Comparison
The Relationship Between Precision-Recall and ROC Curves proves two theorems:
Theorem 1: For a given dataset, ROC space and PR space have a one-to-one correspondence because they contain exactly the same confusion matrices. We can convert ROC curve to PR curve and vice versa.
Theorem 2: For a dataset with given numbers of positive and negative samples, curve A outperforms curve B in ROC space if and only if curve A also outperforms curve B in PR space.
In Theorem 2, “curve A outperforms curve B” means all parts of curve B coincide with or lie below curve A. In ROC space, a curve more convex toward the upper-left is better. Unlike ROC, PR curves are better when more convex toward the upper-right.
From Theorem 2, ROC and PR metrics seem redundant. Why do we need both? The answer is: they perform very differently with imbalanced samples.
The figure below compares ROC and PR curves (from An introduction to ROC analysis):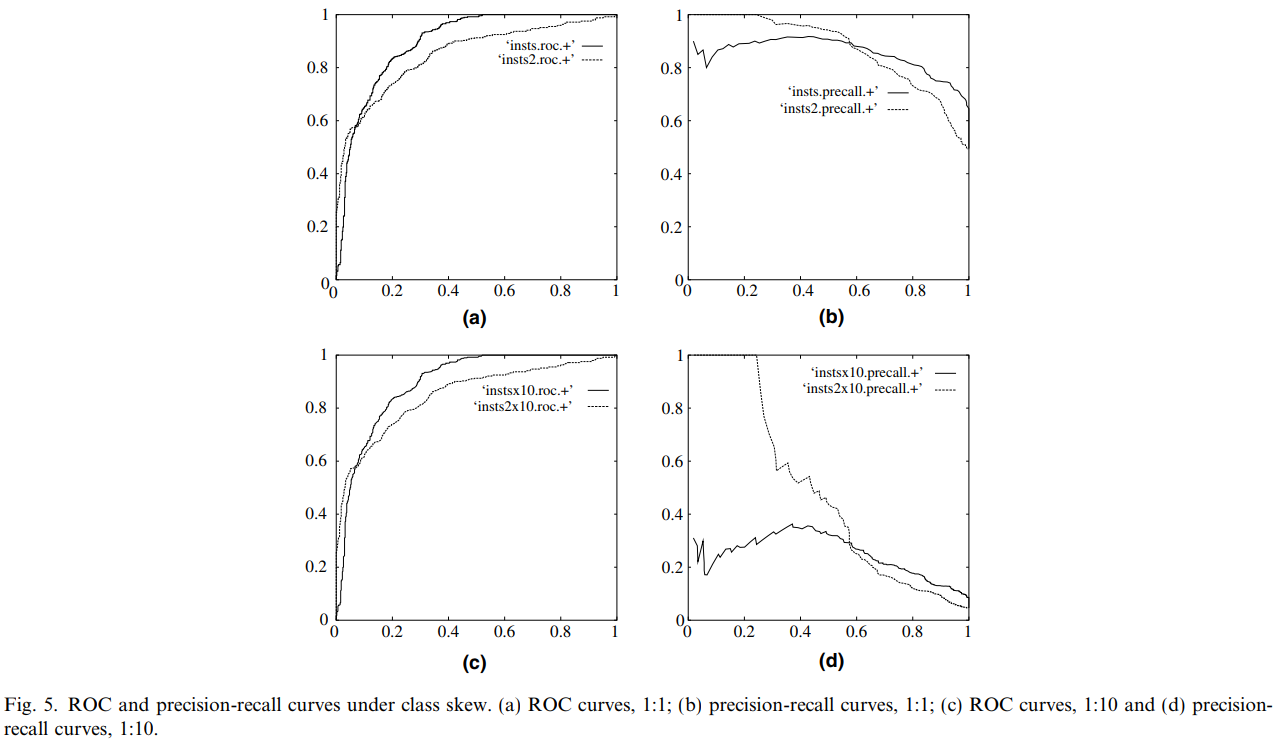
Figures (a) and (b) show ROC and PR curves with 1:1 positive-negative ratio; figures (c) and (d) show 1:100 ratio.
The result shows: When the distribution of positive and negative samples in the test set changes, the ROC curve remains unchanged.
Articles ROC 和 AUC 介绍以及如何计算 AUC and An introduction to ROC analysis consider this an advantage because class imbalance is common in real datasets, and ROC’s robustness to imbalance means the AUC won’t change abruptly.
What does AUC mean? AUC is a probability value representing the probability that a randomly chosen positive sample is ranked higher than a randomly chosen negative sample by the classifier’s score.
Therefore, AUC reflects the model’s ranking ability. Larger AUC means the classifier is more likely to rank positive samples ahead of negatives. This metric is especially useful in scenarios like CTR estimation, where we return the most likely ads to be clicked (ranked by CTR), testing the model’s ranking ability. CTR also has sample imbalance issues with positive-negative ratios often exceeding 1:100. Using PR curves would cause dramatic AUC changes.
However, ROC’s advantage of not changing with class distribution is also its disadvantage. This invariance affects the AUC value, or overall classifier performance evaluation. But in some scenarios, we care more about positive samples, and should use PR curves.
For example, in credit card fraud detection, we care about precision and recall. If we want predictions of fraud to be as accurate as possible, we increase precision; if we want to catch as many potential fraud cases as possible, we increase recall. Generally, increasing threshold increases precision, decreasing threshold increases recall—we can observe the PR curve to find the optimal threshold.
Additionally, the Quora question What is the difference between a ROC curve and a precision-recall curve? gives an example showing PR curves better reflect changes in fraud detection:
Let’s take an example of fraud detection problem where there are 100 frauds out of 2 million samples.
- Algorithm 1: 90 relevant out of 100 identified
- Algorithm 2: 90 relevant out of 1000 identified
Evidently, algorithm 1 is more preferable because it identified less number of false positive.
In the context of ROC curve, - Algorithm 1: TPR=90/100=0.9, FPR= 10/1,999,900=0.00000500025 - Algorithm 2: TPR=90/100=0.9, FPR=910/1,999,900=0.00045502275 The FPR difference is 0.0004500225
For PR Curve - Algorithm 1: precision=0.9, recall=0.9 - Algorithm 2: Precision=90/1000=0.09, recall= 0.9 Precision difference= 0.81
The difference is more apparent in PR curve
Summary
Based on the above (reference: 机器学习之类别不平衡问题 (2) —— ROC 和 PR 曲线):
ROC curve considers both positive and negative examples, suitable for evaluating overall classifier performance (usually computing AUC, representing model’s rank performance), while PR curve focuses entirely on positive examples.
If you have multiple datasets with different class distributions, e.g., credit card fraud where positive-negative ratios vary monthly, and want to purely compare classifier performance eliminating distribution changes, ROC curve is suitable—PR curve may fluctuate with distribution changes. Conversely, to test the impact of different distributions, PR curve is suitable.
To evaluate positive sample prediction under the same class distribution, PR curve is preferable. In class imbalance problems, ROC curve typically gives optimistic estimates, so PR curve is usually better.
Finally, based on specific applications, find the optimal point on the curve to get corresponding precision, recall, F1 score, etc., and adjust the model threshold accordingly.