Reading Notes on "Budget Pacing for Targeted Online Advertisements at LinkedIn"
“Budget Pacing for Targeted Online Advertisements at LinkedIn” is a paper published by LinkedIn in 2014 about budget control. The budget control strategy in this paper is not complex but highly practical and engineering-oriented. This article summarizes the basic principles, engineering implementation, and experimental results based on the paper.
As the name suggests, budget control in an advertising system determines how to reasonably spend the advertiser’s budget. In practice, advertisers often face the problem of budget being consumed too quickly, which causes advertisers to exit bidding early. This not only affects advertiser experience but also reduces the competitiveness of the entire advertising ecosystem (since competitive advertisers run out of budget early). Under a second-price mechanism, this directly impacts platform revenue. To address this problem, the paper proposes a budget pacing algorithm.
Principles
The main idea of the algorithm is to keep the spending trend of each campaign consistent with its impression trend, using a day as the time unit and campaign as the budget control unit. First, the daily impression situation is predicted for each campaign; then, based on the impression situation, if the ratio of spent/total budget is greater than the ratio of impressions/predicted total impressions in the current time slice, it indicates that the budget is being consumed too quickly and the spending rate needs to be reduced. Conversely, the spending rate should be increased.
Let’s detail the principles of this algorithm.
For a campaign \(i\), let its bid be \(b_i\) and daily budget be \(d_i\). The day is divided into \(T\) time windows, where \(s_{i,t}(0 \le t \lt T)\) represents the cumulative budget spent by the beginning of the \(t\)-th time window, and \(f_{i,t}\) corresponds to \(s_{i,t}\), representing the cumulative impressions by the beginning of the \(t\)-th time window (\(f_{i,t}\) is predicted, and \(f_{i,T}\) in the following equation represents the predicted total impressions for campaign \(i\) that day). Then at the beginning of time window \(t\), we have:
\[\begin{align} a_{it} := \frac{f_{i, t}}{f_{i, T}}d_i \end{align}\]
Based on the above ratio, at the start of each bidding round, the probability \(p_{i,t}\) for campaign \(i\) to participate in this bid is calculated. The paper calls this probability PTR (pass through rate), calculated as follows:
\[\begin{align}p_{i,t} = \begin{cases} p_{i, t-1}*(1 + r_t)& s_{i, t} \le a_{i, t}\\\ p_{i, t-1}*(1 - r_t)& s_{i, t} \gt a_{i, t} \end{cases}\]
In the above equation, \(r_t(0 < r_t < 1)\) is called the adjustment rate.
For campaign \(i\), \(a_{it}\) is determined at the beginning of the day since \(f_{i,t}\) is predicted. Therefore, budget control is entirely based on changes in \(s_{i,t}\).
Besides this method of adjusting the campaign’s participation probability in bidding, some literature also suggests intervention through bid adjustment. The following shows the bid adjustment method proposed in paper 1:
\[\begin{align} b_i^* = b_i \psi(s_{i, t}/d_i) \end{align}\]
where \(\psi(x) = 1 - e^{x-1}\). However, the authors of the LinkedIn paper do not recommend this approach because for campaigns with nearly depleted budgets, the bid modification magnitude is small. Moreover, bids generally have a reserve price, leaving little room for adjustment. The paper also experimented with this method, and the results showed no improvement in extending the campaign budget consumption duration.
The entire algorithm is quite simple. Let’s now discuss the specific implementation details.
Implementation Details
PTR Update Frequency
The PTR update frequency is set to once per minute, meaning the time window size is 1 min. Experiments show that this update frequency allows the entire system to reach a stable state more quickly.
Impression Estimation
Estimating the impression volume for a campaign is the most critical part of the algorithm. The paper does not propose its own method for this but instead adopts the method from paper 2, which was proposed by Yahoo for predicting traffic in guaranteed contract advertising. I won’t elaborate here but will write a separate blog post to explain this.
Adjustment Rate Setting
The adjustment rate, denoted as \(r_t\) above, aims to control how quickly PTR changes. The paper sets this value to a fixed 10%, which is not only simple to implement but also highly robust. Another more complex approach would be to set this value to the rate of change of \(s_{i,t}\), i.e., \(\partial s_{i,t}/\partial t\), indicating that campaigns spending too quickly should have a larger adjustment rate. However, the paper still chose the fixed 10% value for two reasons:
The curve represented by \(s_{i,t}\) is not smooth (a series of discrete points), especially for CPC ads where charges only occur upon clicks. In this case, \(s_{i,t}\) fluctuates significantly, making the calculated \(\partial s_{i,t}/\partial t\) quite noisy.
PTR updates are frequent, so even if the current PTR is not at the optimal position, it can quickly update to the ideal position.
Setting Initial PTR Value (Slow Start)
The paper sets the initial PTR value for each campaign to 10% and calls this approach “slow start” because the initial value is small. Setting a smaller initial value gives the system time to adjust each campaign’s PTR. Conversely, if PTR is set very high initially, the budget would be spent quickly.
Similarly, a more reasonable approach would be to set a specific PTR for each campaign, but the paper does not deeply explore this.
Fast Finish
Due to statistical bias in the system causing PTR values to be 偏低, this leads to the daily budget not being fully spent. Fast finish is a solution to this problem. The specific approach is to modify the predicted \(f_{i,t}\) (allocation curve) by setting the impression volume in the last two hours to 0. This causes the budget pacing algorithm to attempt to spend the entire budget within 22 hours each day.
Engineering Design
The figure below shows an overview of LinkedIn’s advertising system. Advertiser actions refer to advertiser behaviors, including creating campaigns, modifying bids or budgets, etc.; ad requests refer to ad requests triggered by user browsing. The campaign index in the ad server records the current status of each campaign (impressions, spending, etc.), and the pacing module updates the campaign index by fetching the latest data from the database at preset update frequencies.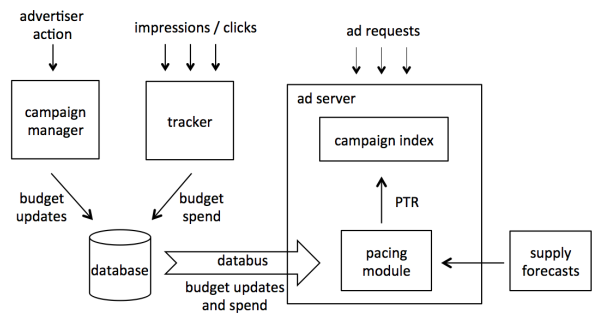
Note that the pacing module’s updates are not completed immediately but rather in a gradual manner. As mentioned above, the pacing update frequency is once per minute, so in practice, about 12% of campaigns are updated every 7 seconds. This update frequency keeps the system load relatively uniform and allows it to reach a stable state quickly.
Experimental Design and Results
Since the pacing approach described above operates at the campaign level, the experiment divides all campaigns equally into two parts as the experimental group and control group (of course, a gradual rollout rather than full rollout could also be used).
To avoid the influence of time factors (weekly patterns, seasonality), the paper believes the experiment should last at least two weeks. The figure below shows the experimental setup for a campaign, where On indicates using the pacing algorithm described above, and Off indicates not using it.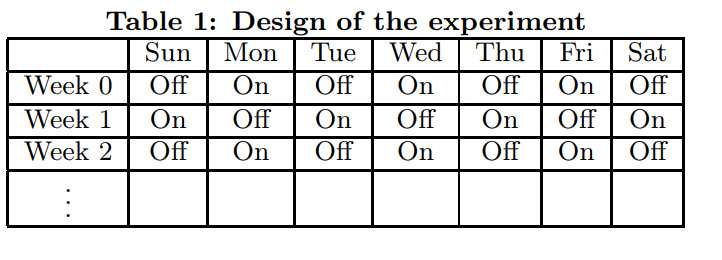
The effect of using pacing is the average of the effects on days marked as On. Which metrics should be used to evaluate the effects?
First, we must recognize that online advertising is a three-way game among advertisers, platforms, and users. Therefore, when considering the gains or losses from any mechanism, we must consider the interests of all three parties. The paper also considers all three parties’ interests and sets the following metrics:
- Advertiser Interests
- Campaign lifetime: Time spent to consume 95% of the budget
- Unique impressions per spend: Number of unique users brought to the advertiser per unit spending, calculated as
number of unique users/total spend - Number of campaigns: Number of campaigns served by the platform that day
- Platform Revenue
- Cost per request: Average revenue per request, calculated as
total revenue/number of requests - Over delivery: Proportion of overspent amount relative to budget
- Cost per request: Average revenue per request, calculated as
- User Experience
- Unique campaigns served: Number of unique campaigns in all ads seen by users, representing the diversity of ads users see. The paper considers larger values to be better.
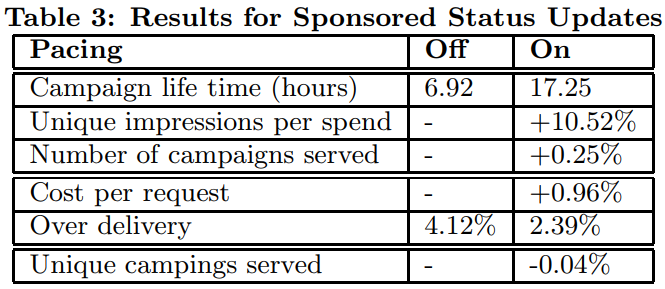
The paper conducted experiments on LinkedIn’s two types of ads (Direct Ads and Sponsored Status Updates) respectively. The results are shown below, where metrics with a + sign indicate the percentage change of On compared to Off. According to the table below, there are significant improvements across all metrics.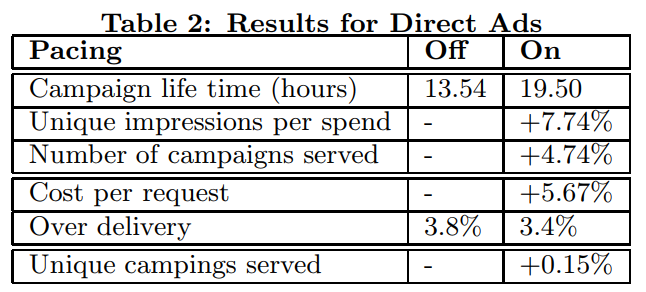
Based on the cost per click metric, we can to some extent understand the current competitiveness of the system. A larger value indicates more intense competition. The paper also compared the system’s competitiveness before and after adopting this strategy using this metric, as shown in the figure below. We can see that after adopting pacing, competition eased in the early period (due to slow start), and then competitiveness improved compared to before. The reason is that campaign lifetime increased, so competitive campaigns don’t exit the bidding environment early.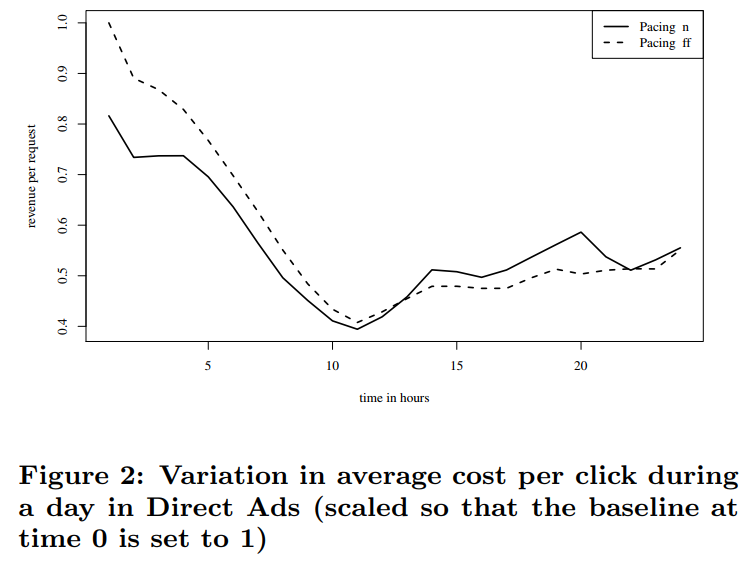
Paper References
1 A. Mehta, A. Saberi, U. Vazirani, and V. Vazirani.Adwords and generalized on-line matching. Journal of the ACM, 54(5):Article no. 22, October 2007 2 D. Agarwal, D. Chen, L.-j. Lin, J. Shanmugasundaram, and E. Vee. Forecasting high-dimensional data. In Proceedings of the 2010 ACM SIGMOD International Conference on Management of Data, SIGMOD ’10, pages 1003–1012, New York, NY, USA, 2010. ACM.